19 Answers, 1 is accepted

RadChart does not currently support variable colors in the same data series. However, you can use the plotBands feature on the chart axis. Plot bands define areas in your axis that you can mark with different colors. Thus, you could have the following layout:
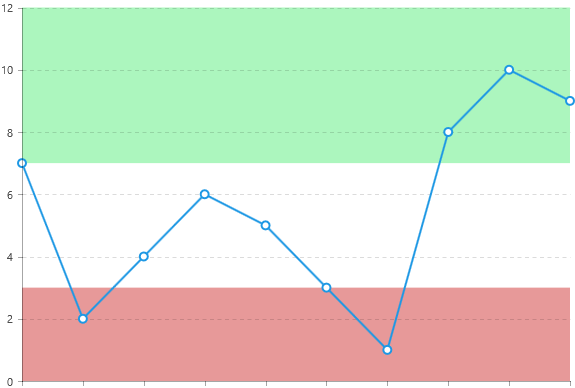
easily achievable with the following configuration:
<div id="chart" data-win-control="Telerik.UI.RadChart" data-win-options="{ theme: 'light', series: [{ type: 'line', data: [7, 2, 4, 6, 5, 3, 1, 8, 10, 9] }], valueAxis: { plotBands: [ { from: 0, to: 3, color: 'rgba(194, 0, 0, 0.4)' }, { from: 7, to: 12, color: 'rgba(48, 233, 92, 0.4)' } ] } }" style="width: 600px"></div>For more information, please refer to the Blot Bands section in the RadChart series documentation.
As for displaying related data on hover and click of chart series, please refer to the RadChart events page from the online documentation. Greetings,
Veli
the Telerik team

You cannot mark specific axis lines and configure every axis line separately, but you can show both major and minor grid lines and play with the majorUnit/minorUnit properties of the chart to configure where exactly is your major grid lines placed. Thus, you can make your minor grid lines appear in their regular style, while the major grid lines can use a distinctive style:
<div id="chart" data-win-control="Telerik.UI.RadChart" data-win-options="{ theme: 'light', series: [{ type: 'line', data: [7, 2, 4, 6, 5, 3, 1, 8, 10, 9] }], valueAxis: { plotBands: [ { from: 0, to: 3, color: 'rgba(194, 0, 0, 0.4)' }, { from: 7, to: 12, color: 'rgba(48, 233, 92, 0.4)' } ], min: 0, max: 11, majorUnit: 5, minorUnit: 1, majorGridLines: { visible: true, dashType: 'solid', width: 2, color: 'red' }, minorGridLines: { visible: true, dashType: 'dot' } } }" style="width: 600px"></div>In the above configuration, we show the minor grid lines and make them look like the regular major grid lines. At the same time, we set a major unit of 5, thus, making the major grid lines show on values 5, 10, 15, etc. Additionally, we make the major grid lines stand out through solid stroke and red color. The result is a distinctive set of major grid lines at regular intervals:
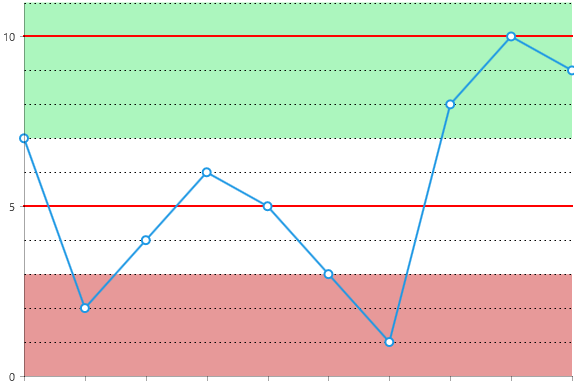
This is as far as the grid lines customization on chart axes go.
On your second question, the plot bands support only CSS-style colors and cannot be further customized with arbitrary content, as they are part of the rendered SVG markup and not regular HTML.
I hope this helps.
Veli
the Telerik team
First of all , many thanks for being so informative ... But I need to draw just one bold line representing the median on the value axis... Is that in any way possible ?
Thanks.
This particular scenario is not supported in the Chart at this stage.
Greetings,Veli
the Telerik team
Thanks a lot for the information so far.... I wanted to ask you , if its possible to track the mouse coordinates on a series as I want to show a pop up that moves along as I hover on the series.
Thanks,
Kavya
For this scenario, you can use the onserieshover event of the chart:
<div id="chart" data-win-control="Telerik.UI.RadChart" data-win-options="{ theme: 'light', series: [{ type: 'line', data: [7, 2, 4, 6, 5, 3, 1, 8, 10, 9] }], onserieshover: chartSeriesHover }" style="width: 600px"></div><script> var chartSeriesHover = WinJS.Utilities.markSupportedForProcessing(function (e) { // custom code here });</script>Inside the series hover event handler, you have the current chart properties you need, such as current hovered series, current data point, current category and the RadChart instance. For more information on RadChart event parameters, please refer to this help topic.
All the best,
Veli
the Telerik team
I got that , but according to my requirements , I need to display a div on hover and make it hidden the moment I move my mouse pointer out of it. As of now , I have only been able to display it on hover , I have no idea how to make it disappear once I move my mouse out of the series.
For that, you can use a mouseleave event handler attached to the RadChart host HTML element:
WinJS.Utilities.ready(function () { WinJS.UI.processAll().then(function () { var chartElement = document.getElementById("chart"); chartElement.addEventListener("mouseleave", function (e) { //your action here }); });});Veli
the Telerik team
Thanks loads , that worked , one more question , is it possible for me to declare the series name in the html and assign the data to it in .js as my data is coming from a WCF service in a WinJS.xhr function... So I wanted the series name to be there in the .html and assign data to it in .js. How do I access the series name there ?
There are a couple of ways to bind your chart to remote data:
1. Use the dataSource property to set up remote data binding:
<div id="chart" data-win-control="Telerik.UI.RadChart" data-win-options="{ theme: 'light', dataSource: { transport: { read: { url: 'http://services.odata.org/Northwind/Northwind.svc/Products?$format=json', dataType: 'json' } }, schema: { data: 'd.results' } }, series: [{ type: 'line', field: 'UnitsInStock' }], categoryAxis: { field: 'ProductName', labels: { rotation: -90 } } }" style="width: 800px; height: 600px">2. Use WinJS.xhr() to retrieve the data, create new series, set the series and category data, refresh:
<div class="container"> <div id="chart2" data-win-control="Telerik.UI.RadChart" data-win-options="{ theme: 'light', categoryAxis: { labels: { rotation: -90 } } }" style="width: 800px; height: 600px"></div></div><script> WinJS.Utilities.ready(function () { WinJS.UI.processAll().then(function () { var chart2 = document.getElementById("chart2").winControl; WinJS.xhr({ url: 'http://services.odata.org/Northwind/Northwind.svc/Products?$format=json' }).then(function (xhr) { if (xhr.status === 200) { var response = JSON.parse(xhr.response), data = response.d.results; var lineSeries = new Telerik.UI.Chart.LineSeries(); lineSeries.data = data.map(function (item) { return item.UnitsInStock; }); chart2.series.push(lineSeries); chart2.categoryAxis.categories = data.map(function (item) { return item.ProductName; }); chart2.refresh(); } else { //handle error cases } }); }); });</script>3. Define the chart series in data-win-options, set the data programmatically after retrieving it with WinJS.xhr():
<div id="chart3" data-win-control="Telerik.UI.RadChart" data-win-options="{ theme: 'light', series: [ { type: 'line' } ], categoryAxis: { labels: { rotation: -90 } } }" style="width: 800px; height: 600px"></div>var chart3 = document.getElementById("chart3").winControl;WinJS.xhr({ url: 'http://services.odata.org/Northwind/Northwind.svc/Products?$format=json' }).then(function (xhr) { if (xhr.status === 200) { var response = JSON.parse(xhr.response), data = response.d.results; chart3.series[0].data = data.map(function (item) { return item.UnitsInStock; }); chart3.categoryAxis.categories = data.map(function (item) { return item.ProductName; }); chart3.refresh(); } else { //handle error cases }});The three approaches are equivalent. I'm attaching the test page demonstrating all of them working OK. Let me know if any of them suits your needs. Regards,
Veli
the Telerik team

using a plot band with a small size, i.g. small difference between from and to values:
...
valueAxis: {
plotBands: [
{ from: 80, to: 80.5, color: 'red' }
]
}
...
Bruno
While developing the app , I came up with yet another doubt , Can we add a series at run time , say in the ready function of the page ?
I mean if I haven't declared it in the html page and I want to add a series based on the info that is coming from a previous page , is that possible ?
Thanks.
You can add series dynamically. Check this article to see how this is done with line series:
Line Series
(look at the second section: Defining line series programmatically)
The same approach is valid for all series types.
If the series type may vary, you can also check this example for changing the series type on demand:
Change the Series Type Dynamically
The code from both examples can be used in the ready function, provided RadChart is already instantiated (with or without series). If it isn't, you can directly define it in JavaScript along with the series.
Regards,
Tsvetina
the Telerik team
I did that , but what is happening is , I have to add multiple series one after the another , data for which is being fetched by winJS.xhr function , but in this case the data (name and data) of a series added earlier is being overwritten by the new one when added.
Say , I add series[0] with some data , when i add series[1] it overwrites all properties of series[0] with its own.
How do i solve that ?
Thanks
I am sending you an example where I used the approach from the first article and it works as expected.
The code for adding series to RadChart can be found in pages\home.js and looks like this:
var series = new Telerik.UI.Chart.LineSeries();var data = [];for (var i = 0; i < 5; i++) { data.push(Math.random());}series.data = data;chart.series.push(series);chart.refresh();Can you confirm that you tried using the push() method of the series Array, instead of using indexes?
Regards,
Tsvetina
the Telerik team
Yes I used the same... but my problem is I have to add multiple series , not just one , it works for one , but when i add another one , it overwrites the properties of the previous one.
See below code for reference:
if (Data.contactreason[0] != undefined) {
var lineseries = new Telerik.UI.Chart.LineSeries();
var urlrequired1 = basebaseurl + Data.contactreason[0] + "&Type=" + grname + "&forhour=" + Data.hour + "&Priority=" + prio + "&GroupName=" + options.GroupName + "&SubGroupName=" + options.SubGroupName;
WinJS.xhr({ url: urlrequired1 }).done(function (r) {
var result = JSON.parse(r.responseText);
for (var k = 0; k < cc.length; k++) {
anum[k] = result.GetMoreGraphDetailsResult[k].CountAtHour;
}
lineseries.name = Data.contactreason[0];
lineseries.data = anum;
lineChart4.series.push(lineseries);
lineChart4.refresh();
});
}
and to add the next series i do :
if (Data.contactreason[1] != undefined) {
var anum2 = new Array(cc.length);
var lineseries = new Telerik.UI.Chart.LineSeries();
var urlrequired2 = basebaseurl + Data.contactreason[1] + "&Type=" + grname + "&forhour=" + Data.hour + "&Priority=" + prio + "&GroupName=" + options.GroupName + "&SubGroupName=" + options.SubGroupName;
WinJS.xhr({ url: urlrequired2 }).done(function (r) {
var result = JSON.parse(r.responseText);
for (var k = 0; k < cc.length; k++) {
anum2[k]= result.GetMoreGraphDetailsResult[k].CountAtHour;
}
lineseries.data = anum2;
lineseries.name = Data.contactreason[1];
lineChart4.series.push(lineseries);
lineChart4.refresh();
result = null;
});
//var test = Data.contactreason[i];
//lineChart4.refresh();
}
In the sample I sent to you, you can also add multiple series, which leads to no problem with the data, assigned to them. Clicking the button multiple times, adds up to 5 series to the chart and each keeps its original data.
In your code I see one series being added. Is the piece of code you posted inside another for loop? If so, and you are doing multiple asynchronous requests at the same time, it is possible that you do not get data in the same order as you have requested it or multiple refreshes of the chart are called at the same time, causing unexpected behavior.
I would advice you to debug the code which creates the series and inspect in what order they are added and what is available inside the series array before refreshing the chart. If my assumption is correct, you can try modifying your logic so it joins the xhr requests and creates all series at once after all requests have returned their response.
If the issue persists, you can open a formal support ticket and send us a runnable sample that reproduces it (or modify mine until the issue is reproduced inside it). We will debug it on our side and let you know what is wrong.
As for removing series - as long as you know the name or other specific, you can use the Array built-in methods to locate and remove a series. For example, if you have a series named "Series3", you can use:
var chart = document.getElementById("chart1").winControl;var seriesIndex = -1;chart.series.forEach(function (item, index) { if (item.name == "Series3") seriesIndex = index; });if (seriesIndex >= 0) { chart.series.splice(seriesIndex, 1); chart.refresh();}Note that if you do not set colors to each series explicitly, when you remove a series, all following series in the array will switch they color. For example if your series are colored "red", "green", "blue", "purple" and you
remove the third one, the fourth will now be third and colored in blue.
Kind regards,
Tsvetina
the Telerik team