Hello,
I am able to see my bar chart when designing my report, but when I click on Preview, the chart appears blank. I am not sure how to resolve this issue.
I have one datasource for my query, and another datasource for the parameter (paramApp). Ideally I want the client to select an Application Period and visually see how many applications were received, completed, etc.
Any help is greatly appreciated!
Hi Kristine,
I am really sorry to hear that you are experiencing issues with our product.
I am afraid that the screenshots cannot be previewed. Can you please attaching them again? If the problem is only reproducible in the viewer, may I ask you to provide me with a Fiddler Jam log? It will give me more details about the problem. Please, check how you may log and submit the captured traffic. See also the How to Record a Log with the Fiddler Jam Extension Youtube video for clarity.
Hi Neli! Thank you for your response. I have attached 2 screenshots. The first one shows my report in design mode, the second shows when I click on the Preview button. If you want me to upload my TRDX file, I can also do that if it is helpful.
I would prefer not to add the extension to Chrome if possible as we use the Tango Chrome extension for documentation, etc.
Hi Kristine,
Thank you for the provided screenshots. If the problem is reproducible in the Standalone designer, you can also send us the TRDX report with sample data in CSV or JSON format, so I can run it locally.
Hi Neli,
I was trying to attach both the CSV and TRDX files but I am getting an error message for both that they have an invalid extension and cannot be uploaded. Is there another way to send you the files?
Hi Kristine,
Can you zip the files and try to attach them? You can also upload them to a cloud storage and provide us the link to download.
Hi Neli,
I have attached the zip file with 2 screenshots of my report and data I am expecting to see.
Hello Kristine,
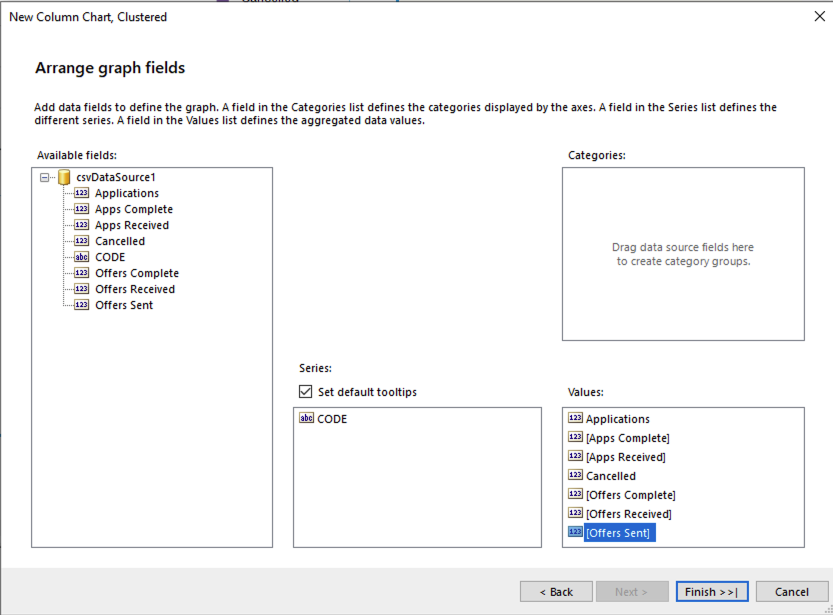
Thank you for the provided data and screenshots. I created the report based on your requirement. Please, find it attached. This is how you can build the graph.