Technical FAQ for Developers
Find answers for the most frequently asked questions

What is Web Report Designer?
The Web-based Report Designer or simply Web Report Designer is the next-gen tool we actively evolve to deliver report editing capability to end-users without their having to leave the web application. Unlike other report designers, it is a control, a jQuery widget, so that it can be fully integrated into your application. The vision for it is to provide the next level of user experience editors so that end-users feel comfortable with it. With this designer, users may create and edit declarative report definitions (.trdx and .trdp files) and report books (.trbp files).
The designer relies on a web service backend that retrieves and saves the report definition into your repository. It is fully customizable so that you can save the reports in your database or other storage of choice. The web service is implemented into your app as a .NET Core or .NET Framework API controller. The client-side jQuery widget is build using the Telerik Kendo UI widgets that get added to your views. The widget exposes options determining the initially loaded report and its behavior and view. Having this architecture, the designer gets easily deployed to the end-users as part of your application.
The Web Report Designer is integrated in Telerik Reporting alongside with Desktop Standalone Report Designer and Visual Studio Report Designer. The Web Report Designer is also integrated into Telerik Report Server, still like a second option to the Desktop Report Designer, so it needs to be firstly enabled from the Report Server web manager options. The Web Designer offers full integration with the server-specific operations like Lock, Save, and Publish, which enable the multi-user collaboration without collisions on a single Report Server instance. The designer also benefits from the white labeling feature of the Report Server, so it completely blends with the buyer's color scheme.
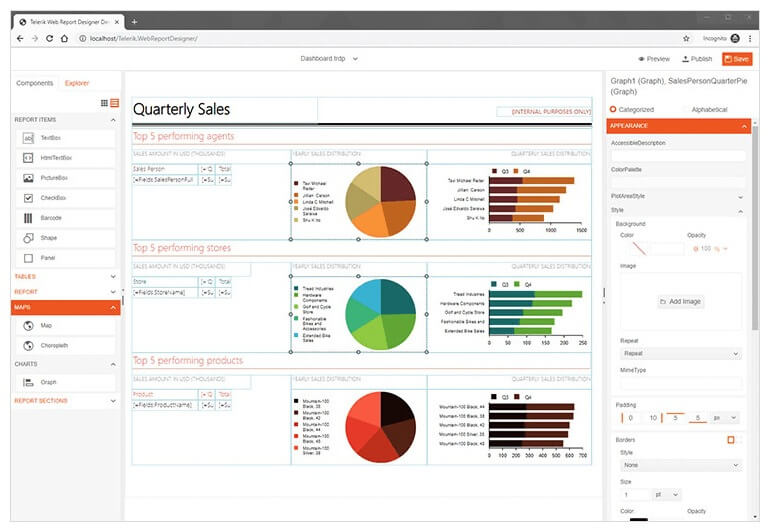
The designer implements a rich feature set for editing which is actively developed further. The workbench offers a top toolbar area with carefully chosen functionality to make it simple and guiding for the end-user. The Insert area in the left alternates with the Explorer area. The former lists all available report item templates and data source templates that the user can add to the report. The latter provides a visual representation of the parent-child relation for all items already part of the report, including the report item itself as a root item. It also incorporates the available data sources, each with a list of the available fields, including the calculated fields. On the right, the designer includes a user-friendly Properties area that displays custom, easy to use editors for each item property of the currently selected item.
Finally, as a central area, the designer displays the Report Design Surface, the heart of the designer bringing the visual representation of the report, and all its child items, enabling pixel-perfect items movement and resizing.
You can evaluate and see all the benefits of Telerik Reporting by downloading a 30-day free trial. Doing so will get you access to our support with response time of less than 24 hours. The trial will also provide you with detailed resources to make the Getting started experience as smooth as possible.
For more information about report designers, visit our report designers page.
