Exporting Spreadsheet with Bar Charts in .NET Standard
Environment
| Version | Product | Author |
|---|---|---|
| 2026.1.402 | RadSpreadProcessing | Desislava Yordanova |
Description
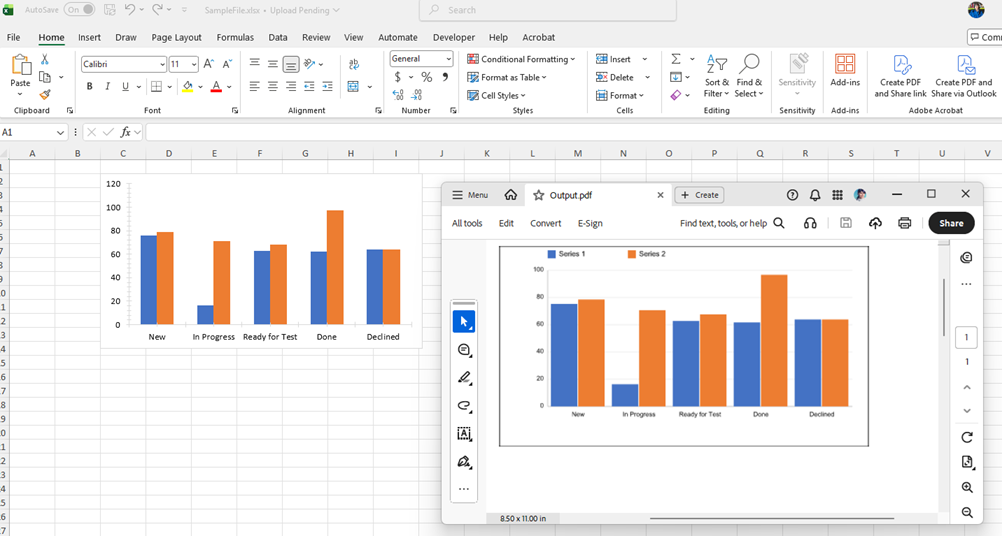
RadSpreadProcessing provides support for exporting worksheets with chart objects to PDF format only in .NET Framework and .NET (Target OS: Windows). This article shows a custom approach to exporting Excel workbooks containing bar chart objects to PDF format using the Telerik Document Processing libraries. Because the standard PDF export does not natively render FloatingChartShape objects, this solution converts each chart into a PNG image and replaces the original chart shape with a FloatingImage at the same position before exporting to PDF.
Solution
The provided solution follows these steps:
- Generate a Workbook with Charts: The
GenerateWorkbookWithChart()method builds aWorkbookwith aWorksheetcontaining a column chart. The chart is constructed programmatically using the Telerik SpreadProcessing model. The workbook is first exported to.xlsxformat for verification. - Convert the Charts to image format: Call
ChartToImageConverter.ConvertChartToImage()to render the chart as a PNG byte array. - Replace the Charts with the Images: Construct a
FloatingImageat the sameCellIndex, offset, width, and height as the original chart. Remove all originalFloatingChartShapeobjects from the worksheet, then add the generatedFloatingImageobjects. - Export to PDF format: After replacement, the workbook (now containing images instead of charts) is exported to PDF using
PdfFormatProvider.
The
ChartToImageConverterclass is the core of the custom implementation. It uses the Telerik Fixed Document API (RadFixedDocument,FixedContentEditor) to draw a visual representation of the chart, then exports the rendered page to PNG usingSkiaImageFormatProvider.
The Program class:
    internal class Program
    {
        static void Main(string[] args)
        {
            Telerik.Documents.ImageUtils.ImagePropertiesResolver defaultImagePropertiesResolver = new Telerik.Documents.ImageUtils.ImagePropertiesResolver();
            Telerik.Windows.Documents.Extensibility.FixedExtensibilityManager.ImagePropertiesResolver = defaultImagePropertiesResolver;

            Workbook workbook  = GenerateWorkbookWithChart();
            string fileName = "SampleFile.xlsx";
            Telerik.Windows.Documents.Spreadsheet.FormatProviders.OpenXml.Xlsx.XlsxFormatProvider formatProvider = new Telerik.Windows.Documents.Spreadsheet.FormatProviders.OpenXml.Xlsx.XlsxFormatProvider();

            using (Stream output = new FileStream(fileName, FileMode.Create))
            {
                formatProvider.Export(workbook, output, TimeSpan.FromSeconds(10));
            }
            Process.Start(new ProcessStartInfo() { FileName = fileName, UseShellExecute = true });

            ReplaceChartWithImages(workbook);

            Telerik.Windows.Documents.Spreadsheet.FormatProviders.Pdf.PdfFormatProvider pdfFormatProvider = new PdfFormatProvider();

            string outputFilePath = "Output.pdf";
            File.Delete(outputFilePath);
            using (Stream output = File.OpenWrite(outputFilePath))
            {
                pdfFormatProvider.Export(workbook, output, TimeSpan.FromSeconds(10));
            }
            Process.Start(new ProcessStartInfo() { FileName = outputFilePath, UseShellExecute = true });
        }

        private static Workbook GenerateWorkbookWithChart()
        {
            Workbook workbook = new Workbook();
            Worksheet worksheet = workbook.Worksheets.Add();
            FloatingChartShape chartShape = new FloatingChartShape(worksheet, new CellIndex(1, 2), new CellRange(1, 1, 1, 1), ChartType.Column)
            {
                Width = 460,
                Height = 250
            };

            DocumentChart chart = new DocumentChart();
            BarSeriesGroup barSeriesGroup = new BarSeriesGroup();
            barSeriesGroup.BarDirection = BarDirection.Column;

            StringChartData barCategoryData = new StringChartData(new List<string> { "New", "In Progress", "Ready for Test", "Done", "Declined" });
            NumericChartData barValueScore1Data = new NumericChartData(new List<double> { 75.31, 16.3, 62.78, 61.72, 63.9 });
            NumericChartData barValueScore2Data = new NumericChartData(new List<double> { 78.56, 70.7, 67.63, 96.71, 63.9 });
            barSeriesGroup.Series.Add(barCategoryData, barValueScore1Data);
            barSeriesGroup.Series.Add(barCategoryData, barValueScore2Data);
            chart.SeriesGroups.Add(barSeriesGroup);
            ValueAxis valueAxis = new ValueAxis();
            valueAxis.Outline.Fill = new SolidFill(new ThemableColor(ThemeColorType.Text1, 0.85));
            valueAxis.Outline.Width = 0.75;

            CategoryAxis categoryAxis = new CategoryAxis();
            categoryAxis.Outline.Fill = new SolidFill(new ThemableColor(ThemeColorType.Text1, 0.85));
            categoryAxis.Outline.Width = 0.75;

            chart.PrimaryAxes = new AxisGroup(categoryAxis, valueAxis);
            worksheet.Charts.Add(chartShape);

            worksheet.Charts[0].Chart.SeriesGroups.First().Series.First().Title = new TextTitle("Team 1");
            worksheet.Charts[0].Chart.SeriesGroups.First().Series.Last().Title = new TextTitle("Team 2");
            chartShape.Chart = chart;

            return workbook;
        }

        private static void ReplaceChartWithImages(Workbook workbook)
        {
            // Iterate all charts in all worksheets, generate images, and replace charts with images
            foreach (Worksheet ws in workbook.Worksheets)
            {
                var chartShapes = ws.Charts.ToList();
                var imagesToAdd = new List<(FloatingImage image, byte[] data)>();

                foreach (FloatingChartShape cs in chartShapes)
                {
                    byte[] imageBytes = ChartToImageConverter.ConvertChartToImage(cs, workbook.Theme);
                    if (imageBytes.Length == 0) continue;

                    FloatingImage floatingImage = new FloatingImage(ws, cs.CellIndex, cs.OffsetX, cs.OffsetY)
                    {
                        Width = cs.Width,
                        Height = cs.Height
                    };
                    floatingImage.ImageSource = new Telerik.Windows.Documents.Media.ImageSource(imageBytes, "png");

                    imagesToAdd.Add((floatingImage, imageBytes));
                }

                // Remove all chart shapes
                foreach (FloatingChartShape cs in chartShapes)
                {
                    ws.Charts.Remove(cs);
                }

                // Add images
                foreach (var (image, _) in imagesToAdd)
                {
                    ws.Images.Add(image);
                }
            }
        }
    }
The ChartToImageConverter class:
    internal static class ChartToImageConverter
    {
        public static byte[] ConvertChartToImage(FloatingChartShape chartShape, DocumentTheme theme = null)
        {
            double width = chartShape.Width;
            double height = chartShape.Height;

            RadFixedDocument document = new RadFixedDocument();
            RadFixedPage page = document.Pages.AddPage();
            page.Size = new Size(width, height);

            FixedContentEditor editor = new FixedContentEditor(page);

            DocumentChart chart = chartShape.Chart;
            if (chart == null)
            {
                return Array.Empty<byte>();
            }

            // Draw background
            editor.GraphicProperties.FillColor = new RgbColor(255, 255, 255);
            editor.DrawRectangle(new Rect(0, 0, width, height));

            double marginLeft = 60;
            double marginRight = 20;
            double marginTop = 30;
            double marginBottom = 50;
            double chartAreaWidth = width - marginLeft - marginRight;
            double chartAreaHeight = height - marginTop - marginBottom;

            // Collect all series data
            var allSeriesData = new List<(string title, List<double> values)>();
            var categoryLabels = new List<string>();

            foreach (var seriesGroup in chart.SeriesGroups)
            {
                foreach (var series in seriesGroup.Series)
                {
                    string title = $"Series {allSeriesData.Count + 1}";
                    if (series.Title is TextTitle textTitle)
                    {
                        title = textTitle.Text;
                    }

                    var values = new List<double>();
                    if (series is CategorySeriesBase catSeries)
                    {
                        if (catSeries.Values is NumericChartData numericData)
                        {
                            values.AddRange(numericData.NumericLiterals);
                        }

                        if (categoryLabels.Count == 0 && catSeries.Categories is StringChartData stringCatData)
                        {
                            categoryLabels.AddRange(stringCatData.StringLiterals);
                        }
                    }

                    allSeriesData.Add((title, values));
                }
            }

            if (allSeriesData.Count == 0)
            {
                return Array.Empty<byte>();
            }

            int categoryCount = categoryLabels.Count > 0 ? categoryLabels.Count : allSeriesData.Max(s => s.values.Count);
            int seriesCount = allSeriesData.Count;

            // Use axis min/max from the chart's ValueAxis when available
            double dataMax = allSeriesData.SelectMany(s => s.values).DefaultIfEmpty(0).Max();

            double minValue = 0;
            double maxValue = dataMax;

            if (chart.PrimaryAxes != null)
            {
                var valueAxis = chart.PrimaryAxes.ValueAxis;
                if (valueAxis != null)
                {
                    if (valueAxis.Min.HasValue)
                        minValue = valueAxis.Min.Value;
                    if (valueAxis.Max.HasValue)
                        maxValue = valueAxis.Max.Value;
                }
            }

            // If max was not explicitly set, round up to a nice value (Excel-style: 0, 10, 20, ...)
            bool maxExplicit = chart.PrimaryAxes?.ValueAxis?.Max.HasValue == true;
            if (!maxExplicit)
            {
                double roughInterval = dataMax / 5.0;
                if (roughInterval <= 0) roughInterval = 1;
                double magnitude = Math.Pow(10, Math.Floor(Math.Log10(roughInterval)));
                double residual = roughInterval / magnitude;
                double niceInterval;
                if (residual <= 1.5) niceInterval = 1 * magnitude;
                else if (residual <= 3.5) niceInterval = 2 * magnitude;
                else if (residual <= 7.5) niceInterval = 5 * magnitude;
                else niceInterval = 10 * magnitude;

                maxValue = Math.Ceiling(dataMax / niceInterval) * niceInterval;
            }

            // Extract original fill colors from each series
            var seriesColors = new List<RgbColor>();
            RgbColor[] fallbackColors = new RgbColor[]
            {
                new RgbColor(79, 129, 189),
                new RgbColor(192, 80, 77),
                new RgbColor(155, 187, 89),
                new RgbColor(128, 100, 162),
                new RgbColor(75, 172, 198)
            };
            int seriesIdx = 0;
            foreach (var seriesGroup in chart.SeriesGroups)
            {
                foreach (var series in seriesGroup.Series)
                {
                    RgbColor color = fallbackColors[seriesIdx % fallbackColors.Length];
                    if (series.Fill is SolidFill solidFill)
                    {
                        var themableColor = solidFill.Color;
                        Telerik.Documents.Media.Color actualColor = theme != null
                            ? themableColor.GetActualValue(theme)
                            : themableColor.LocalValue;
                        color = new RgbColor(actualColor.R, actualColor.G, actualColor.B);
                    }
                    seriesColors.Add(color);
                    seriesIdx++;
                }
            }

            // Draw axes
            editor.GraphicProperties.StrokeColor = new RgbColor(180, 180, 180);
            editor.GraphicProperties.StrokeThickness = 0.75;

            editor.DrawLine(new Point(marginLeft, marginTop),
                           new Point(marginLeft, marginTop + chartAreaHeight));

            editor.DrawLine(new Point(marginLeft, marginTop + chartAreaHeight),
                           new Point(marginLeft + chartAreaWidth, marginTop + chartAreaHeight));

            // Grid lines and Y-axis labels
            int gridLineCount = 5;
            for (int i = 0; i <= gridLineCount; i++)
            {
                double yVal = minValue + (maxValue - minValue) * i / gridLineCount;
                double yPos = marginTop + chartAreaHeight - (chartAreaHeight * i / gridLineCount);

                editor.GraphicProperties.StrokeColor = new RgbColor(220, 220, 220);
                editor.GraphicProperties.StrokeThickness = 0.5;
                editor.DrawLine(new Point(marginLeft, yPos),
                               new Point(marginLeft + chartAreaWidth, yPos));

                editor.SavePosition();
                editor.Position.Translate(marginLeft - 55, yPos - 6);
                Block labelBlock = new Block();
                labelBlock.HorizontalAlignment = Telerik.Windows.Documents.Fixed.Model.Editing.Flow.HorizontalAlignment.Right;
                labelBlock.TextProperties.FontSize = 8;
                labelBlock.InsertText(yVal.ToString("F0"));
                editor.DrawBlock(labelBlock, new Size(50, 12));
                editor.RestorePosition();
            }

            // Draw bars
            double groupWidth = chartAreaWidth / categoryCount;
            double barGap = 4;
            double totalBarWidth = groupWidth - barGap * 2;
            double singleBarWidth = totalBarWidth / seriesCount;

            for (int catIdx = 0; catIdx < categoryCount; catIdx++)
            {
                for (int serIdx = 0; serIdx < seriesCount; serIdx++)
                {
                    double value = catIdx < allSeriesData[serIdx].values.Count ? allSeriesData[serIdx].values[catIdx] : 0;
                    double barHeight = (value - minValue) / (maxValue - minValue) * chartAreaHeight;

                    double barX = marginLeft + catIdx * groupWidth + barGap + serIdx * singleBarWidth;
                    double barY = marginTop + chartAreaHeight - barHeight;

                    RgbColor color = seriesColors[serIdx % seriesColors.Count];
                    editor.GraphicProperties.FillColor = color;
                    editor.GraphicProperties.StrokeColor = color;
                    editor.GraphicProperties.StrokeThickness = 0;
                    editor.DrawRectangle(new Rect(barX, barY, singleBarWidth - 1, barHeight));
                }

                if (catIdx < categoryLabels.Count)
                {
                    double labelX = marginLeft + catIdx * groupWidth;
                    double labelY = marginTop + chartAreaHeight + 5;
                    editor.SavePosition();
                    editor.Position.Translate(labelX, labelY);
                    Block catBlock = new Block();
                    catBlock.HorizontalAlignment = Telerik.Windows.Documents.Fixed.Model.Editing.Flow.HorizontalAlignment.Center;
                    catBlock.TextProperties.FontSize = 8;
                    catBlock.InsertText(categoryLabels[catIdx]);
                    editor.DrawBlock(catBlock, new Size(groupWidth, 30));
                    editor.RestorePosition();
                }
            }

            // Draw legend
            double legendX = marginLeft;
            double legendY = 5;
            for (int serIdx = 0; serIdx < seriesCount; serIdx++)
            {
                RgbColor color = seriesColors[serIdx % seriesColors.Count];
                double itemX = legendX + serIdx * 100;

                editor.GraphicProperties.FillColor = color;
                editor.GraphicProperties.StrokeThickness = 0;
                editor.DrawRectangle(new Rect(itemX, legendY, 10, 10));

                editor.SavePosition();
                editor.Position.Translate(itemX + 14, legendY - 1);
                Block legendBlock = new Block();
                legendBlock.TextProperties.FontSize = 9;
                legendBlock.InsertText(allSeriesData[serIdx].title);
                editor.DrawBlock(legendBlock, new Size(80, 14));
                editor.RestorePosition();
            }

            // Export page to PNG
            SkiaImageFormatProvider imageProvider = new SkiaImageFormatProvider();
            imageProvider.ExportSettings = new SkiaImageExportSettings()
            {
                ImageFormat = SkiaImageFormat.Png
            };
            byte[] imageBytes;
            using (MemoryStream ms = new MemoryStream())
            {
                imageProvider.Export(page, ms, TimeSpan.FromSeconds(10));
                imageBytes = ms.ToArray();
            }

            return imageBytes;
        }
    }
NuGet Packages
| Package | Purpose |
|---|---|
Telerik.Documents.Spreadsheet | Workbook/Worksheet model, chart objects |
Telerik.Documents.Spreadsheet.FormatProviders.OpenXml | XLSX export |
Telerik.Documents.Spreadsheet.FormatProviders.Pdf | PDF export |
Telerik.Documents.Fixed.FormatProviders.Image.Skia | PNG rendering of RadFixedPage |
Telerik.Documents.ImageUtils | ImagePropertiesResolver for image handling |
Limitations
- The rendered chart image is a simplified column/bar chart. Other chart types (line, pie, scatter, and so on) are not currently supported by the converter.
- The visual output is an approximation—font rendering, exact spacing, and styling may differ from the native Excel chart rendering.
- Theme color resolution requires passing the
DocumentTheme. If the theme is unavailable, the converter falls back toThemableColor.LocalValue.