This question is locked. New answers and comments are not allowed.
Well, the subject line pretty much sums it up. I can't find the button to start profiling anywhere.
I am running on Windows7 64bit, with VS2010 premium and resharper installed.
Äny hints on how to get going is appreciated.
br,
Michael
6 Answers, 1 is accepted
0

Nicolaï
Top achievements
 Rank 2
answered on 28 Apr 2011, 07:37 AM
Same here... VS2008..
When running vs2008 as admin, I got some info in "Live Data", but it didn't seem related to my .NET/ajax application...
Idling, I could stil see a hit count running... Don't think it's connecting to the running project..
When running vs2008 as admin, I got some info in "Live Data", but it didn't seem related to my .NET/ajax application...
Idling, I could stil see a hit count running... Don't think it's connecting to the running project..
0

Mel
Top achievements
Rank 2
answered on 28 Apr 2011, 08:13 AM
Same here, VS2008 SP1
When I first started my app, I got the option to enable JustTrace - then it caused VS to crash as the Web Application started. Now I can only access it through the toolbar menu, but I can't enable it...
When I first started my app, I got the option to enable JustTrace - then it caused VS to crash as the Web Application started. Now I can only access it through the toolbar menu, but I can't enable it...
0

Antonio Bakula
Top achievements
 Rank 1
answered on 28 Apr 2011, 11:01 AM
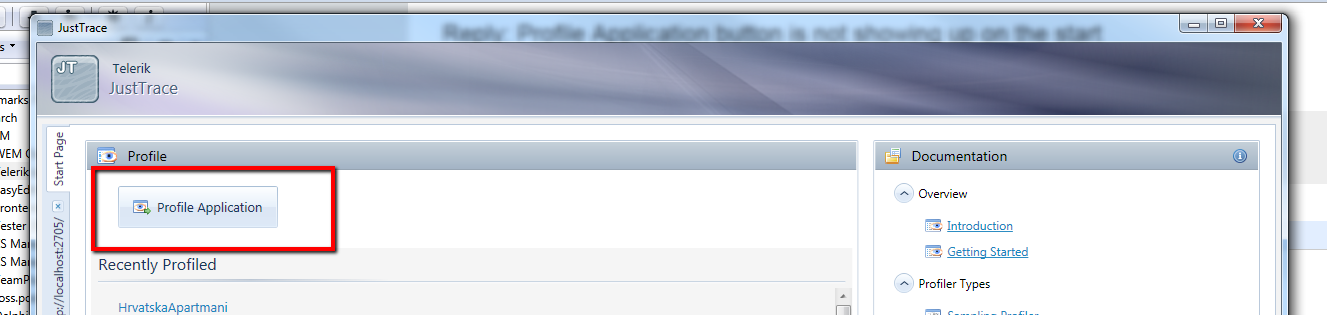
This button is not on Visual Studio start page, instead you have to start Telerik.JustTrace.exe and there is Profile Application button.
Here is the screenshot
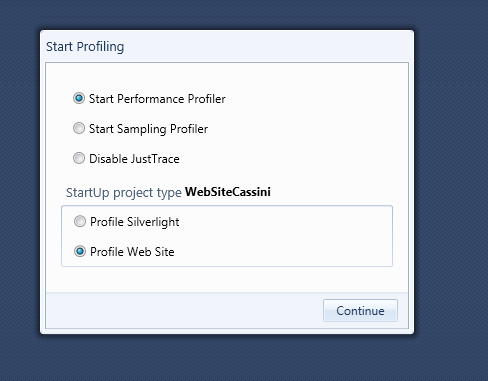
Or just enable JustTrace in Visual Studio and start application with debugging (F5), and dialog should popup to choose profiling type, screenshot :
Here is the screenshot
Or just enable JustTrace in Visual Studio and start application with debugging (F5), and dialog should popup to choose profiling type, screenshot :
0

Phil
Top achievements
Rank 2
answered on 28 Apr 2011, 03:16 PM
Documentation is misleading then, I was expecting to see a link on the Visual Studio Start page. When I start my web site from VS2010 I don't get anything from JustTrace. Nothing was installed in Start menu to start it as a standalone, so I'm left wondering what if anything I just installed ...
0

Hi Phil,
The documentation is not completed indeed. We will provide much better docs for the official release. We will provide start menu integration as well. As for you issue with web site profiling, I need some information. What profiler (memory, sampling, tracing) did you use? Are you running on Windows XP or higher version?
Regards,
Mike
the Telerik team
Explore the entire Telerik portfolio by downloading the Ultimate Collection trial package. Get now >>
0
Phil
Top achievements
Rank 2
answered on 28 Apr 2011, 03:39 PM
Fair comment re the install and documentation.
Performance profiler on Windows 7 Enterprise SP1 32-bit, using WebSiteCassini .
It's a web site, not a web application.
I don't get anything if I connect using the standalone JustTrace and attach to the already running process either.
Performance profiler on Windows 7 Enterprise SP1 32-bit, using WebSiteCassini .
It's a web site, not a web application.
I don't get anything if I connect using the standalone JustTrace and attach to the already running process either.