This is a migrated thread and some comments may be shown as answers.

Data binding for stacked column chart

3 Answers 180 Views
Chart for HTML
This is a migrated thread and some comments may be shown as answers.
This question is locked. New answers and comments are not allowed.
Scott
Top achievements
Rank 1
Scott asked on 16 Jan 2013, 01:32 PM
I have a web service that returns the following data for a sample Coupon Tracker app that tracks how many coupons are Active or Expired in each category:

[
{"couponType":"Drinks","status":"Active","total":"3"},
{"couponType":"Drinks","status":"Expired","total":"1"},
{"couponType":"Snacks","status":"Active","total":"12"},
{"couponType":"Snacks","status":"Expired","total":"3"},
{"couponType":"Desserts","status":"Active","total":"1"}
]

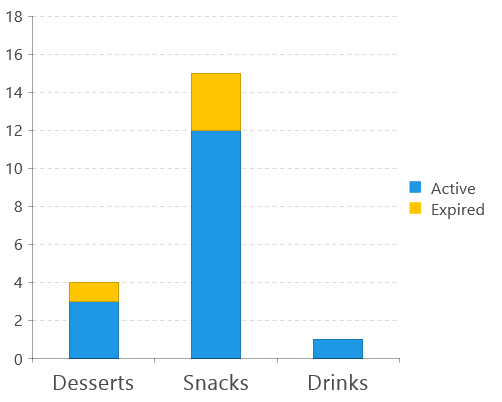
I would like to perform simple data binding against this data to get the following results in a stacked column chart:

(click to see my sample chart)

I saw this post where the data had to be massaged further by use of the array.map() function after it was received from the web service so that it would be in a format that represented each individual series. But is it possible to perform data binding against the type of data my web service is returning without needing to further massage the data inside my app?

3 Answers, 1 is accepted

Sort by
0
Accepted
Tsvetina
Telerik team
answered on 16 Jan 2013, 02:09 PM
Hello Scott,

For your scenarios it is enough to tell the underlying DataSource component to group the data by status and then stack the series:
dataSource: {
    data: dataItems,
    group: { field: "status", order: "asc" }
},
series: [
    {
        type: 'column',
        stack: true,
        field: 'total'
    }
]

A full chart declaration that achieves the look from your screenshot follows below:
var chart = new Telerik.UI.RadChart(document.getElementById("chart1"), {
    dataSource: {
        data: dataItems,
        group: { field: "status", order: "asc" }
    },
    series: [
        {
            type: 'column',
            stack: true,
            field: 'total'
        }
    ],
    valueAxis: {
        max: 18,
        labels: {
            font: "12pt segoe ui"
        }
    },
    categoryAxis: {
        field: 'couponType',
        labels: {
            font: "16pt segoe ui"
        }
    },
    legend: {
        labels: {
            font: "12pt segoe ui"
        }
    },
    width: 500,
    theme: 'light'
});

where dataItems is:
var dataItems = [
     { "couponType": "Desserts", "status": "Active", "total": "3" },
     { "couponType": "Desserts", "status": "Expired", "total": "1" },
     { "couponType": "Snacks", "status": "Active", "total": "12" },
     { "couponType": "Snacks", "status": "Expired", "total": "3" },
     { "couponType": "Drinks", "status": "Active", "total": "1" }
];

And this is the resulting chart:


I am also attaching a sample project for your reference. Let me know if it helps.

Kind regards,
Tsvetina
the Telerik team
Have a suggestion or face a problem - you can use the Ideas & Feedback portal to submit ideas, feedback and vote for them.
0
Scott
Top achievements
Rank 1
answered on 16 Jan 2013, 07:42 PM
Thank you, Tsvetina, that indeed worked. However, when I add one more line to the data set (couponType = "Other"), instead of rendering a new column, it instead stacks that column on top of the existing "Drinks" column:
var dataItems = [
{ "couponType": "Desserts", "status": "Active", "total": "3" },
{ "couponType": "Desserts", "status": "Expired", "total": "1" },
{ "couponType": "Snacks", "status": "Active", "total": "12" },
{ "couponType": "Snacks", "status": "Expired", "total": "3" },
{ "couponType": "Drinks", "status": "Active", "total": "1" },
{ "couponType": "Other", "status": "Expired", "total": "1" },
];

(click here for chart image)

I suspect this is happening because the data set does not contain a data row for the "Drinks"/"Expired" combination since there are no Expired Drink coupons in the database. Since it's pretty common for a database query not to return a data row if there are no matching items in that category, what can be done here?
0
Tsvetina
Telerik team
answered on 17 Jan 2013, 09:42 AM
Hi Scott,

To get a series for each status (so you can stack them by two), you need to have a record for each status. So, for the specific look that you want to achieve, you would need to modify the logic which returns data or to process the returned data, so an Active and Expired record is returned for each coupon type.
If you had:
var dataItems = [
    { "couponType": "Desserts", "status": "Active", "total": "3" },
    { "couponType": "Desserts", "status": "Expired", "total": "1" },
    { "couponType": "Snacks", "status": "Active", "total": "12" },
    { "couponType": "Snacks", "status": "Expired", "total": "3" },
    { "couponType": "Drinks", "status": "Active", "total": "1" },
    { "couponType": "Drinks", "status": "Expired", "total": "0" },
    { "couponType": "Other", "status": "Active", "total": "0" },
    { "couponType": "Other", "status": "Expired", "total": "1" }
];

the result would be the desired:


Your other option is to group the data the other way around, if it would be acceptable - group by couponType and then have the series stacked:
var chart = new Telerik.UI.RadChart(document.getElementById("chart1"), {
    dataSource: {
        data: dataItems,
        group: { field: "couponType", order: "asc" }
    },
    series: [
    {
        type: 'column',
        stack: true,
        field: 'total'
    }
    ],
    valueAxis: {
        max: 18,
        labels: {
            font: "12pt segoe ui"
        }
    },
    categoryAxis: {
        field: 'status',
        labels: {
            font: "16pt segoe ui"
        }
    },
    legend: {
        labels: {
            font: "12pt segoe ui"
        }
    },
    seriesColors: ["#7C66CC", "#4F75FF", "#51ADDB", "#C48BEF", "#60C179"],
    width: 500,
    theme: 'light'
});

Even with missing status records, you would get correct stacking in this case:


Regards,
Tsvetina
the Telerik team
Have a suggestion or face a problem - you can use the Ideas & Feedback portal to submit ideas, feedback and vote for them.
Tags
Chart for HTML
Asked by
Scott
Top achievements
Rank 1
Answers by
Tsvetina
Telerik team
Scott
Top achievements
Rank 1
Share this question
or