New to Telerik Document Processing? Start a free 30-day trial
How to Update the CellRange used for the FloatingChartShape in RadSpreadProcessing
Updated on Jun 9, 2026
Environment
| Version | Product | Author |
|---|---|---|
| 2024.1.124 | RadSpreadProcessing | Desislava Yordanova |
Description
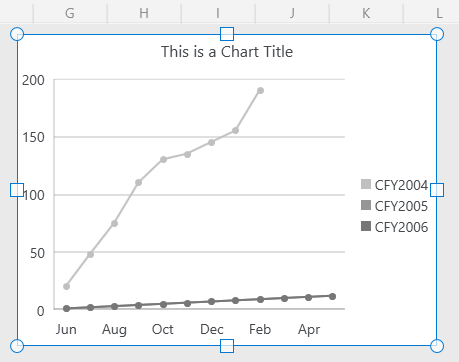
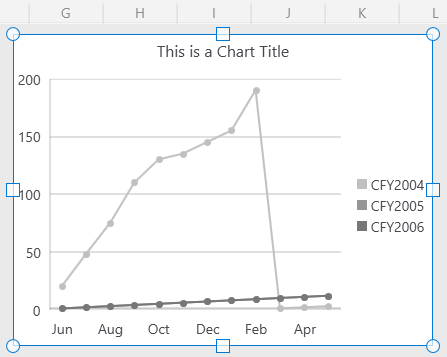
When the CellRange used for generating the chart object in a worksheet contains blank or empty values, they are converted to zero values. This may change the chart line in an unexpected way. This article shows how to update the chart's CellRange and set the range's end when such empty values are found. The range with null values is cut.
Solution
After importing the XLSX document into a Workbook, iterate the chart shapes and limit the CellRange to the first found blank or empty value:
csharp
 Worksheet worksheet = this.Workbook.ActiveSheet as Worksheet;
         foreach (FloatingChartShape chartShape in worksheet.Charts)
         {
             DocumentChart chart = chartShape.Chart;
             LineSeriesGroup group = chart.SeriesGroups.First() as LineSeriesGroup;
             if (group==null)
             {
                 continue;
             }
             CategorySeriesBase firstSeries = group.Series.Where(s => s is CategorySeriesBase).First() as CategorySeriesBase;
             CellIndex start ;
             CellIndex end;
             CellRange usedChartRange;
             WorkbookFormulaChartData formulaChartData = firstSeries.Values as WorkbookFormulaChartData;
             if (NameConverter.TryConvertCellRangeNameToCellRange(formulaChartData.Formula , out usedChartRange))
             {
                 start = usedChartRange.FromIndex;
                 end = start;
                 for (int rowIndex = usedChartRange.FromIndex.RowIndex; rowIndex <= usedChartRange.ToIndex.RowIndex; rowIndex++)
                 {
                     for (int columnIndex = usedChartRange.FromIndex.ColumnIndex; columnIndex <= usedChartRange.ToIndex.ColumnIndex; columnIndex++)
                     {
                         CellSelection cell = worksheet.Cells[rowIndex, columnIndex];
                         string value = cell.GetValue().Value.RawValue;
                         FormulaCellValue  formulaValue = cell.GetValue().Value as FormulaCellValue;
                         if (formulaValue!=null)
                         {
                             value = formulaValue.GetResultValueAsString(cell.GetFormat().Value);
                         }
                         if (value=="" || value=="0" ||value=="#N/A")
                         {
                             break;
                         }

                         end = new CellIndex(rowIndex, columnIndex);
                     }
                 }
                 usedChartRange = new CellRange(start, end);
                 firstSeries.Values= new  WorkbookFormulaChartData(worksheet, usedChartRange);
             }
         }