
Telerik Reporting
Embed Reports in Any Application
- Add reporting capabilities to any business application. View reports in web, desktop, and cloud integrating dedicated Report Viewer components. Export reports to multiple document formats.
- Complete .NET embedded reporting tool for web and desktop applications
- Supports: Blazor, Angular, React, ASP.NET Core, ASP.NET MVC, ASP.NET Web Forms, HTML5/JS, WPF, WinForms and WinUI.
-
ReportViewer Controls - Create Once, Deliver Everywhere
With Telerik .NET Reporting, you can deliver interactive reports directly to your web or desktop application. Reports can be viewed in ASP.NET Core, Blazor, ASP.NET MVC, HTML5, Angular, React, Vue, WPF, WinForms, WinUI, Azure Cloud, ASP.NET Web Forms and Touch Web Applications, where we aim for the same look and feel of the reports, regardless of the platform.
Blazor Reporting
Embed Telerik Reporting using a dedicated control called Native Blazor Report Viewer. It is implemented by composing Telerik UI for Blazor controls to offer a native user experience. The control blends with the rest of your application by using the same input controls and stylization mechanism.
Learn how to embed Reporting into your native Blazor applications.If you choose this embeddability option, you will need a Telerik UI for Blazor license on top of the Telerik Reporting license or the cost-effective Telerik DevCraft bundle license in place of the two single-product licenses.
Alternatively, use the Blazor Report Viewer (wrapper) which is a thin wrapper of the HTML5/JS jQuery-dependent Report Viewer. It is built on top of Kendo UI for jQuery and offers extensive JS modification APIs. Both viewers can be added to your application using a manual setup or dedicated Visual Studio item templates.
Angular Reporting
Similar to the Blazor support, there are two embeddability options for Angular applications. The Native Angular Report Viewer offers a native experience as it is built by composing Kendo UI for Angular components. If this components suite is used for the whole application the result will be a blending stylization of the reporting preview experience with the rest of the app functionality. This would additionally enable easy adoption of the company design system where needed.
Learn how to embed Reporting into your native Angular applications.Additionally, there is a Visual Studio Code extension automating the viewer integration. If you choose this control, you will additionally need a Kendo UI license or the cost-effective Telerik DevCraft bundle license instead of the two individual product licenses.
Alternatively, use the Angular Report Viewer (wrapper) which is an Angular wrapper of the original HTML5/JS jQuery-dependent Report Viewer. This viewer is built on top of Kendo UI for jQuery and offers extensive JS modification APIs.
HTML5 Reporting
The HTML5 report viewer control is an HTML/CSS/JS client-side widget, which does not require assembly references. It is suitable for any web application that works with JavaScript, including React and Vue.js applications.
Learn how to embed Reporting into your HTML5 applications.ASP.NET Core Reporting
ASP.NET Core Report report viewer combined with HTML5 report viewer is suitable for ASP.NET Core applications running on Windows, Linux and macOS.
Learn how to embed Reporting into your ASP.NET Core applications.ASP.NET MVC Reporting
The HTML5 ASP.NET MVC report viewer control allows you to configure the HTML5 viewer via server-side code. It renders the JavaScript viewer object and required scripts on the page and is suitable for ASP.NET MVC4/MVC5 projects.
Learn how to embed Reporting into your ASP.NET MVC applications.ASP.NET Web Forms Reporting
The ASP.NET Web Forms Report Viewer is a server-side wrapper around the HTML5 Report Viewer. It is designed to be used in new ASP.NET WebForms applications or as a replacement of the obsolete Telerik Reporting ASP.NET Report Viewer in existing applications.
Learn how to embed Reporting into your ASP.NET Web Forms applications.WPF Reporting
The WPF report viewer control is suitable for WinForms and WPF projects. It is built on top of our comprehensive WPF suite, so it supports their theming mechanism.
Learn more how to embed Reporting into your WPF applications.WinForms Reporting
The WinForms report viewer control is suitable for WinForms and WPF projects. It is built with standard Microsoft controls and can operate with an embedded reporting engine or as a client of the Telerik Reporting.
Learn more about Report Viewer Controls.WinUI Reporting
Telerik Reporting WinUI report viewer enables fast and easy embedding of reports that can be previewed directly into a WinUI application. The viewer is built using the Telerik UI for WinUI control suite to take advantage of the improved controls and be compatible with future themes.
With the native WinUI viewer users will be able to:
- Navigate the report pages for preview on the screen
- Exercise the defined interactivities like Navigate to another report or to a bookmark in the same one, drill-down or sort on a column, etc.
- Print or export the report to all the formats we support, including PDF and Excel
- Search the report contents to easily find particular data points
Learn how to embed Reporting into your WinUI applications.
React Reporting
Telerik Reporting React report viewer component ensures fast and easy embedding and preview of reports into a React web application. The viewer is built as a wrapper of the HTML5 Report Viewer widget, inheriting all its features, including:
- Navigate the report pages for preview on the screen
- Exercise the defined interactivities like Navigate to another report or to a bookmark in the same one, drill-down or sort on a column, etc.
- Print or export the report to all supported formats, including PDF and Excel
-
Bring Interactive Reports to Your Users
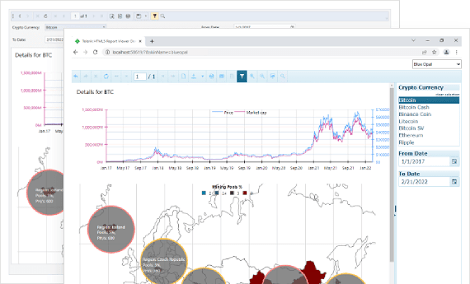
Add drill-down and drill-through actions to your reports, insert a document map to jump to a report section and add hyperlinks to external web pages. These interactive features are available in all report viewers and designers. The HTML5 report viewer also offers screen-optimized touch capabilities.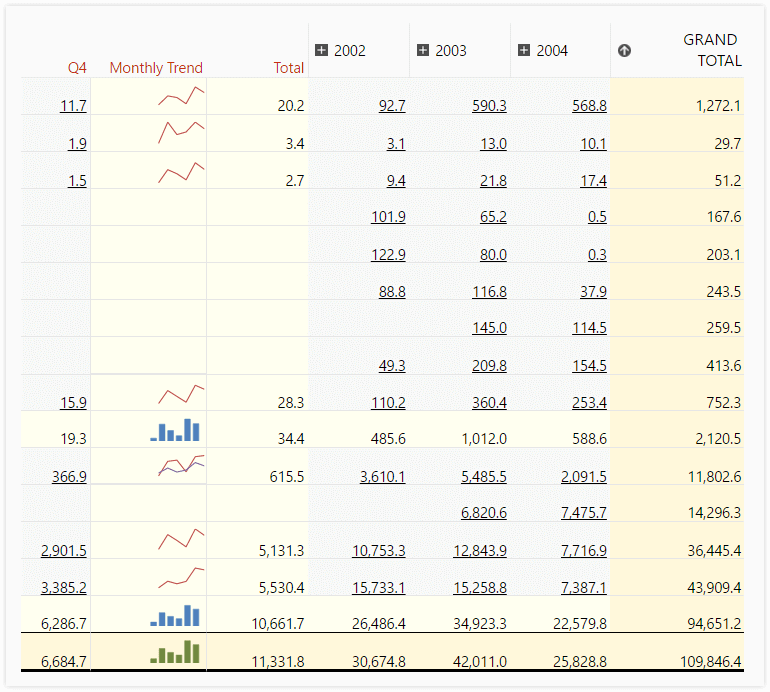
-
Filter and Sort Data at Run-Time
Add report parameters to customize the report data at run-time, filter, sort and group data interactively, connect related reports and sub-reports, modify data presentation, and even change report properties. -
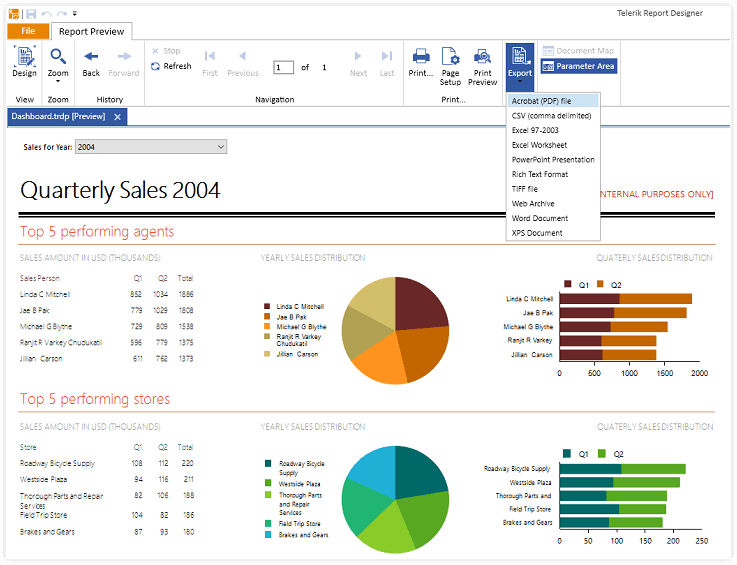
Export to 15-Plus Formats
Export Telerik reports to the most common formats for further data analysis and report sharing:
- Microsoft Excel 97+ (XLS and XLSX)
- Microsoft Word 2007+
- Microsoft PowerPoint 2007+
- Adobe PDF
- MHTML
- Comma Separated Values (CSV)
- Rich Text Format (RTF)
- All image formats supported by GDI+ (JPEG, PNG, GIF, BMP, TIFF, etc.)
-
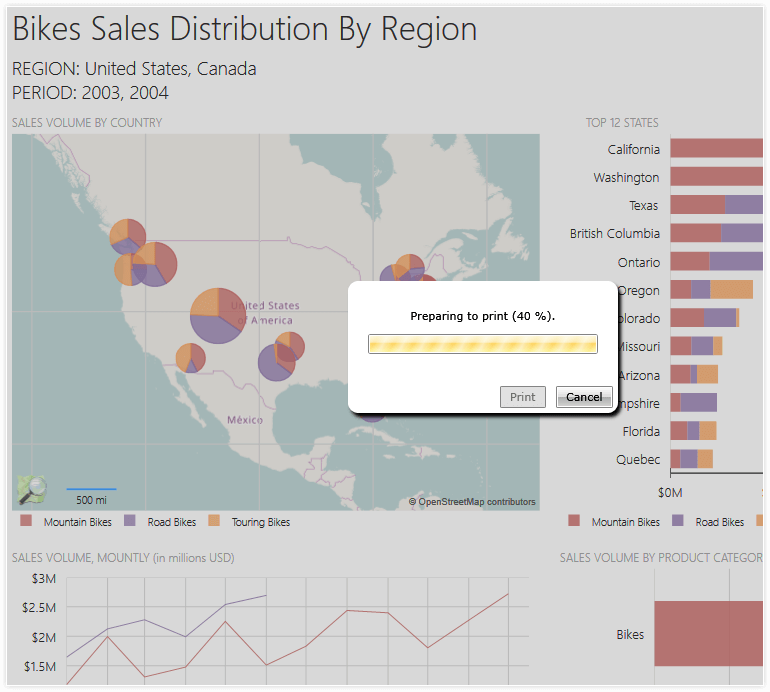
Print Reports
When you are ready to print or export, switch to Print Preview to view the report exactly as it would appear on paper. This functionality is provided in all report viewers and designers. True Printing through the ASP.NET and HTML5 viewers is also supported.
-
ReportViewer Themes
Telerik Reporting ensures nice integration in your application by supporting themes and skinning for all of its report viewers. You can choose to use the predefined themes, or create a new one.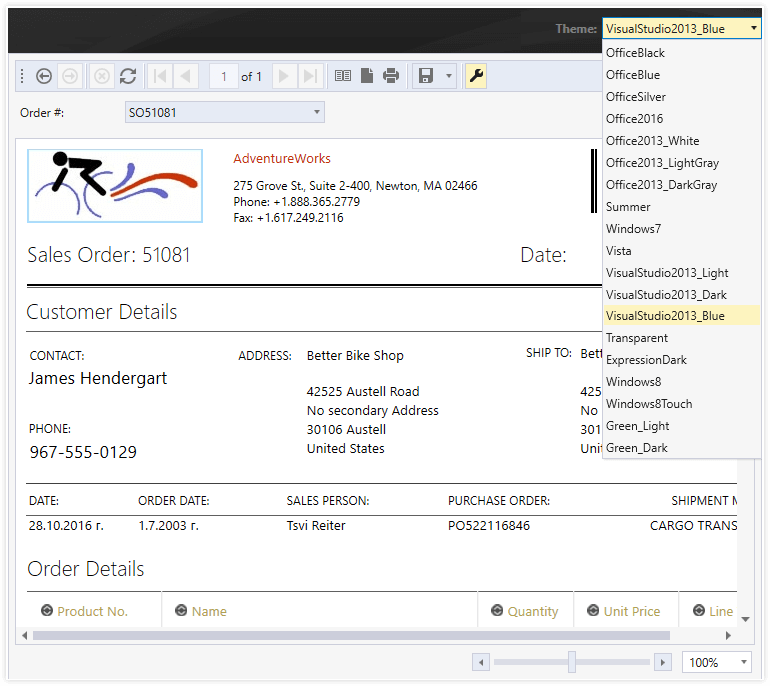
-
Web API and .NET API for Generating Report Documents
Our report generation APIs enable the utilization of the Telerik Reporting engine to export documents into any of the supported formats. By providing the report definition, parameters, and desired document format, developers can effortlessly generate reports. The .NET API is compatible with both .NET and .NET Framework applications, offering versatility. Similarly, the Web API, suitable for hosting within .NET or .NET Framework web applications, allows invocation from any client. Additionally, our .NET libraries support deployment across Windows and Linux platforms, whether on-premise or in the Cloud, ensuring flexibility.
