Hi,
here you can see my code:
<telerik:RadChart ID="RadChart12" runat="server" Width="600px" Height="400px" DataSourceID="SqlDataSource12" AutoLayout="true" SeriesOrientation="Vertical" Style="float: left;">
<ChartTitle TextBlock-Text="Slot History" TextBlock-Appearance-TextProperties-Color="#333333" Appearance-FillStyle-MainColor="Transparent"></ChartTitle>
<Appearance Border-Color="Transparent" >
<FillStyle MainColor="Transparent" />
</Appearance>
<Legend Visible="false">
<Appearance ItemTextAppearance-TextProperties-Color="White" FillStyle-MainColor="Transparent" GroupNameFormat="#VALUE">
</Appearance>
</Legend>
<Series>
<telerik:ChartSeries Name="Total Trains" DataYColumn="count" >
<Appearance>
<LabelAppearance Visible="FALSE"></LabelAppearance>
<FillStyle MainColor="#fbb03b" SecondColor="#fbb03b" >
</FillStyle>
</Appearance>
</telerik:ChartSeries>
<telerik:ChartSeries Name="Cumulative Percentage" YAxisType="Secondary" DataYColumn="Pct_To_Total" DataLabelsColumn="labelPerc" Type="Spline">
<Appearance>
<TextAppearance TextProperties-Color="Black"></TextAppearance>
<FillStyle MainColor="Red">
</FillStyle>
</Appearance>
</telerik:ChartSeries>
</Series>
<PlotArea Appearance-FillStyle-MainColor="Transparent" Appearance-FillStyle-SecondColor="Transparent" >
<YAxis2 Appearance-TextAppearance-TextProperties-Color="#333333" Appearance-MajorGridLines-Visible="false" Appearance-MinorGridLines-Visible="false"></YAxis2>
<YAxis Appearance-TextAppearance-TextProperties-Color="#333333" Appearance-MajorGridLines-Visible="false" Appearance-MinorGridLines-Visible="false"></YAxis>
<XAxis Appearance-LabelAppearance-RotationAngle="45" Appearance-TextAppearance-TextProperties-Color="#333333" DataLabelsColumn="slotcount" Appearance-MajorGridLines-Visible="false" Appearance-MinorGridLines-Visible="false">
</XAxis>
</PlotArea>
</telerik:RadChart>
here the sql result:
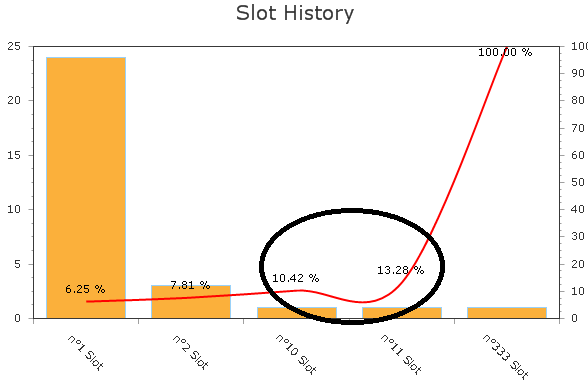
and here the result:

My problem is that the line does not have to go down and it happens when i use type=Spline to have the curved line...
Can You please help me to understand if this is my fault or if this is telerik issue and can i do anything to show a correct curved line?
here you can see my code:
<telerik:RadChart ID="RadChart12" runat="server" Width="600px" Height="400px" DataSourceID="SqlDataSource12" AutoLayout="true" SeriesOrientation="Vertical" Style="float: left;">
<ChartTitle TextBlock-Text="Slot History" TextBlock-Appearance-TextProperties-Color="#333333" Appearance-FillStyle-MainColor="Transparent"></ChartTitle>
<Appearance Border-Color="Transparent" >
<FillStyle MainColor="Transparent" />
</Appearance>
<Legend Visible="false">
<Appearance ItemTextAppearance-TextProperties-Color="White" FillStyle-MainColor="Transparent" GroupNameFormat="#VALUE">
</Appearance>
</Legend>
<Series>
<telerik:ChartSeries Name="Total Trains" DataYColumn="count" >
<Appearance>
<LabelAppearance Visible="FALSE"></LabelAppearance>
<FillStyle MainColor="#fbb03b" SecondColor="#fbb03b" >
</FillStyle>
</Appearance>
</telerik:ChartSeries>
<telerik:ChartSeries Name="Cumulative Percentage" YAxisType="Secondary" DataYColumn="Pct_To_Total" DataLabelsColumn="labelPerc" Type="Spline">
<Appearance>
<TextAppearance TextProperties-Color="Black"></TextAppearance>
<FillStyle MainColor="Red">
</FillStyle>
</Appearance>
</telerik:ChartSeries>
</Series>
<PlotArea Appearance-FillStyle-MainColor="Transparent" Appearance-FillStyle-SecondColor="Transparent" >
<YAxis2 Appearance-TextAppearance-TextProperties-Color="#333333" Appearance-MajorGridLines-Visible="false" Appearance-MinorGridLines-Visible="false"></YAxis2>
<YAxis Appearance-TextAppearance-TextProperties-Color="#333333" Appearance-MajorGridLines-Visible="false" Appearance-MinorGridLines-Visible="false"></YAxis>
<XAxis Appearance-LabelAppearance-RotationAngle="45" Appearance-TextAppearance-TextProperties-Color="#333333" DataLabelsColumn="slotcount" Appearance-MajorGridLines-Visible="false" Appearance-MinorGridLines-Visible="false">
</XAxis>
</PlotArea>
</telerik:RadChart>
here the sql result:
| slotcount | count | pc_to_total | labelPerc |
| n°1 Slot | 24 | 6.25 | 6.25% |
| n°2 Slot | 3 | 7.81 | 7.81% |
| n°10 Slot | 1 | 10.42 | 10.42% |
| n°11 Slot | 1 | 13.28 | 13.28% |
| n°333 Slot | 1 | 100 | 100.00% |
and here the result:
My problem is that the line does not have to go down and it happens when i use type=Spline to have the curved line...
Can You please help me to understand if this is my fault or if this is telerik issue and can i do anything to show a correct curved line?

