
Hello,
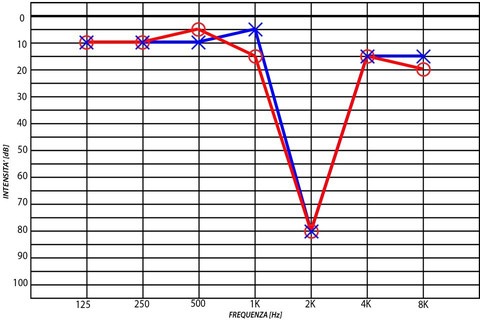
i need to build an Audiometric chart like this in c# .net 4
x values are: 125, 500, 1000, 2000, 4000, 8000 Consider that the series can have intermediate values, example 750, 3000, 6000.
i suppose that values are logarithmic but I could not find the correct values.
3 Answers, 1 is accepted

You can use scatter line series with a logarithmic axis.
Regards,
Danail Vasilev
Telerik
logarithmic axis with which base?
consider that i want to show only these values in x Axis 125, 500, 1000, 2000, 4000, 8000

Hello Luigi,
If you can find a logarithm base that will provide these numbers, setting it to the chart should work. I am not sure, however, that such a value exists.
Thus, I can suggest using a category series and setting the x-axis values yourself. This will remove the grid lines that indicate that the scale is logarithmic, but I do not see them in your original example either. Here is a basic example:
<telerik:RadHtmlChart runat="server" ID="RadHtmlChart1" Width="800px" Height="500px"> <PlotArea> <XAxis> <TitleAppearance Text="Frequency (Hz)"></TitleAppearance> <Items> <telerik:AxisItem LabelText="125" /> <telerik:AxisItem LabelText="500" /> <telerik:AxisItem LabelText="1000" /> <telerik:AxisItem LabelText="2000" /> <telerik:AxisItem LabelText="4000" /> <telerik:AxisItem LabelText="8000" /> </Items> </XAxis> <YAxis Reversed="true" AxisCrossingValue="999999"> <TitleAppearance Text="Intensity (dB)"></TitleAppearance> </YAxis> <Series> <telerik:LineSeries Name="firstSeries"> <Items> <telerik:SeriesItem YValue="10"/> <telerik:SeriesItem YValue="10"/> <telerik:SeriesItem YValue="10"/> <telerik:SeriesItem YValue="80"/> <telerik:SeriesItem YValue="15"/> <telerik:SeriesItem YValue="20"/> </Items> </telerik:LineSeries> </Series> </PlotArea></telerik:RadHtmlChart>Regards, Marin Bratanov
Telerik