Embedded Reporting
Reporting turns data into the information your users need to make good decisions. Embedded reporting puts that information where users need it: in their applications. A complete solution lets users create the embedded reports they need. Now, you can get all this in one embedded reporting tool.
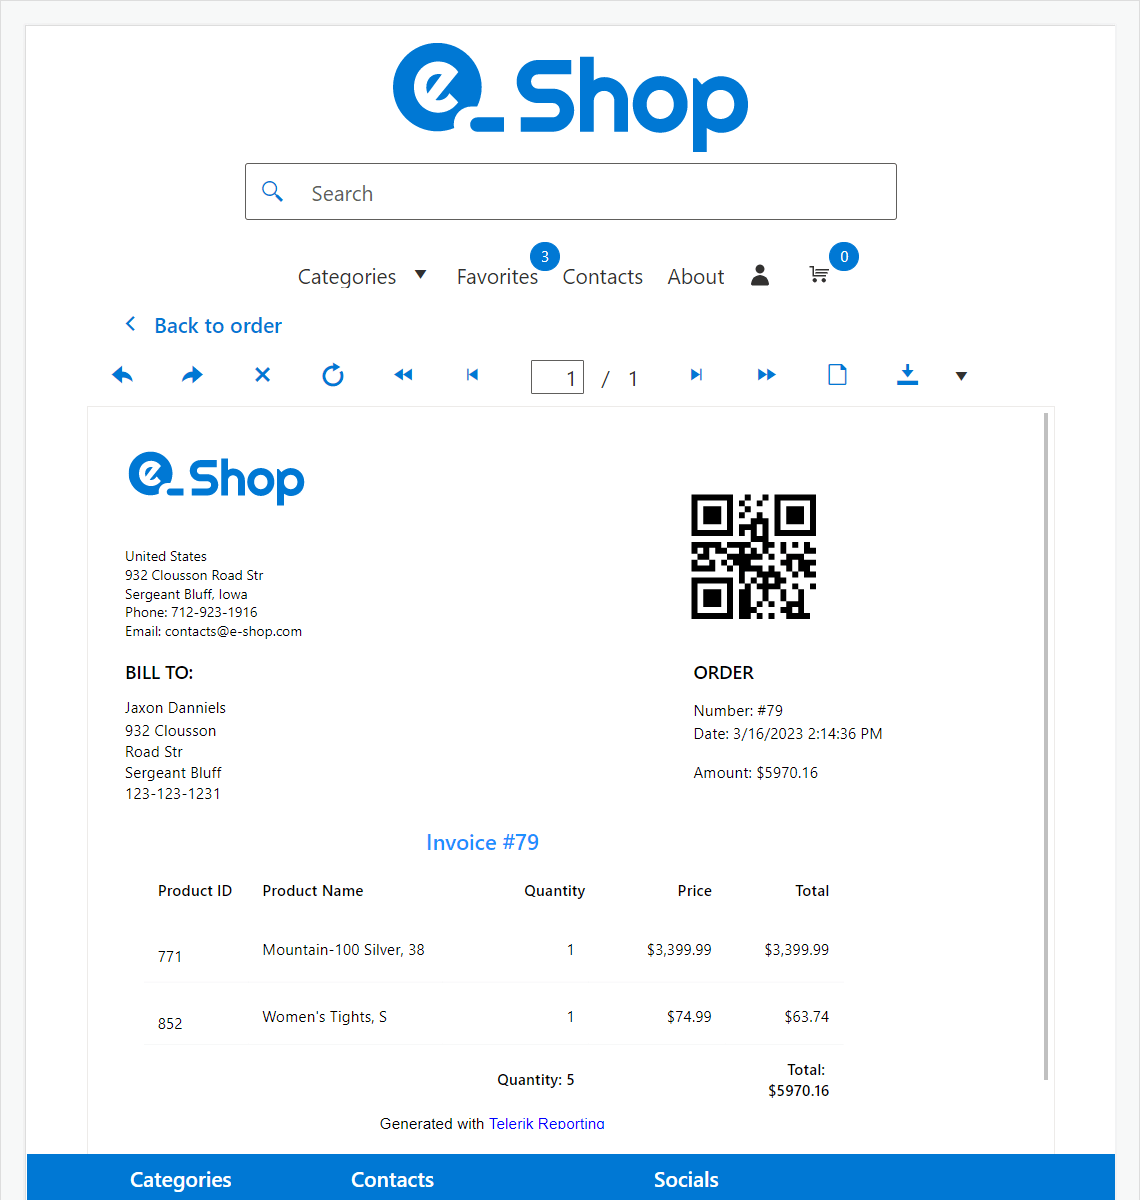
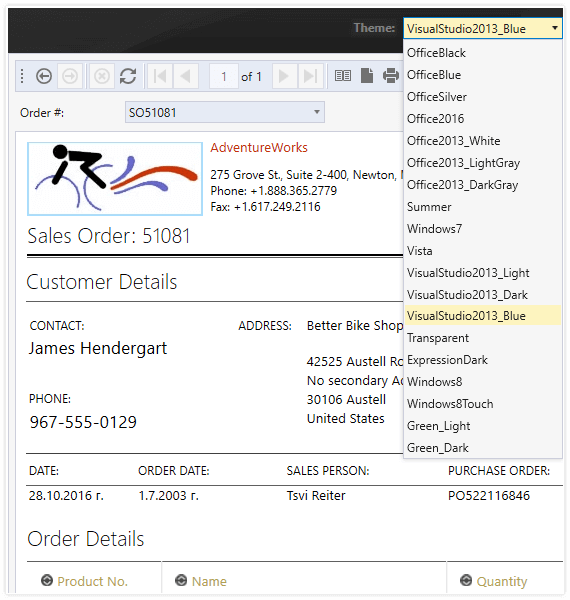
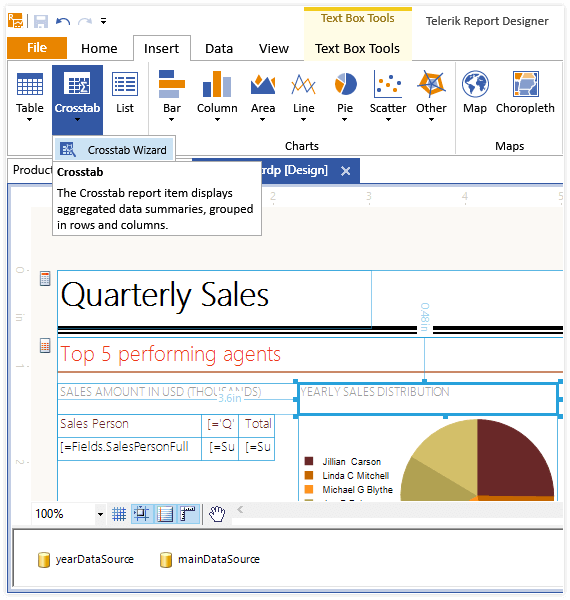
With Telerik Reporting you’ll get a fully functional Web Report Designer that will help you to enable your business users to create, edit, style, view and export reports on their own. The reports can be easily embedded in any web or desktop application.
Your involvement as a developer will be minimal – just in the initial stage of integration. Then business users can take the helm.