Test Studio Step-by-Step: Creating Tests

Learn how to integrate Test Studio into your testing process, including how to handle typical issues when using an automated E2E regression testing tool.
It doesn’t matter if you’re a programmer, a tester or an end user involved in application development—you’re not going to release your application until you know that all the parts work together: the part of the testing methodologies path called integration or end-to-end (E2E) testing. In fact, the only testing that matters is the E2E testing that proves that your application can complete whole business transactions correctly.
The problem is that, while you might have time to do E2E testing once in one release, you don’t have time to repeat every E2E test after every change to your application—or even in every release. At least, you don’t have time if repeat those tests manually.
Which is where a tool like Telerik Test Studio steps in and lets you “re-execute” your E2E tests as often as you need. Provided, of course, you know how to use the tool.
So, here’s how to integrate Test Studio into your testing process, including how to handle the typical problems that are part of using an automated E2E regression testing tool.
Case Study: Contoso University
For this case study, I’m going to use a variation on the Contoso University application. I picked Contoso University because there’s so many versions of the application available (there’s both .NET Framework and .NET Core versions, including implementations Views-and-Controllers and Razor Pages). Test Studio will work with all of them.
For this guide, I moved the application’s Data Access Layer into a web service to make the application into a case study that requires integration. The case study for my tests focuses on updating information about the university’s departments, so I’ve stripped the other functionality out of the application. Feel free to download both my version of the Contoso University application and the Test Studio project I used to test it.
First, a quick overview of the update department functionality: After starting the application, click the Department link in the upper right corner of the application’s main menu.
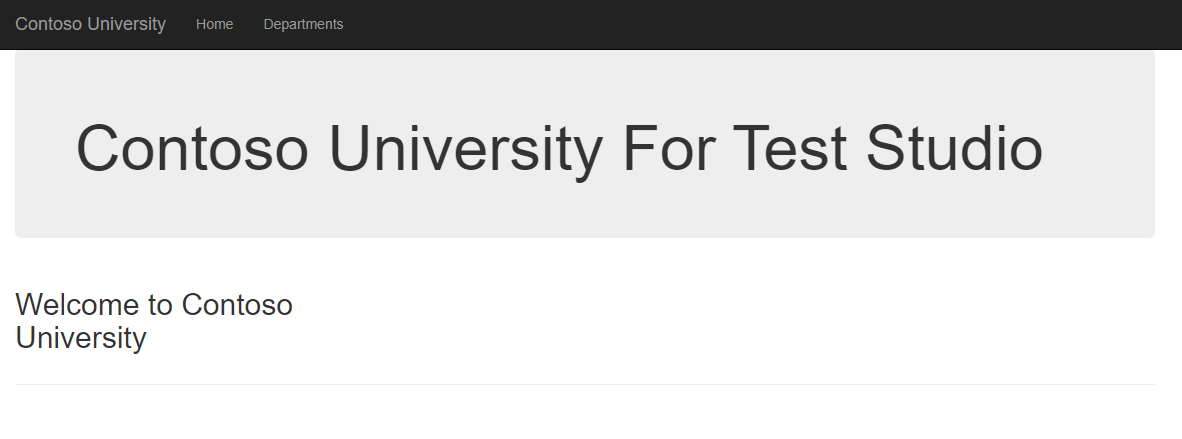
That link leads to the part of the application that calls the Contoso University’s web service that retrieves a collection of Department objects. The application then formats that collection into a list of departments that’s displayed to the user.
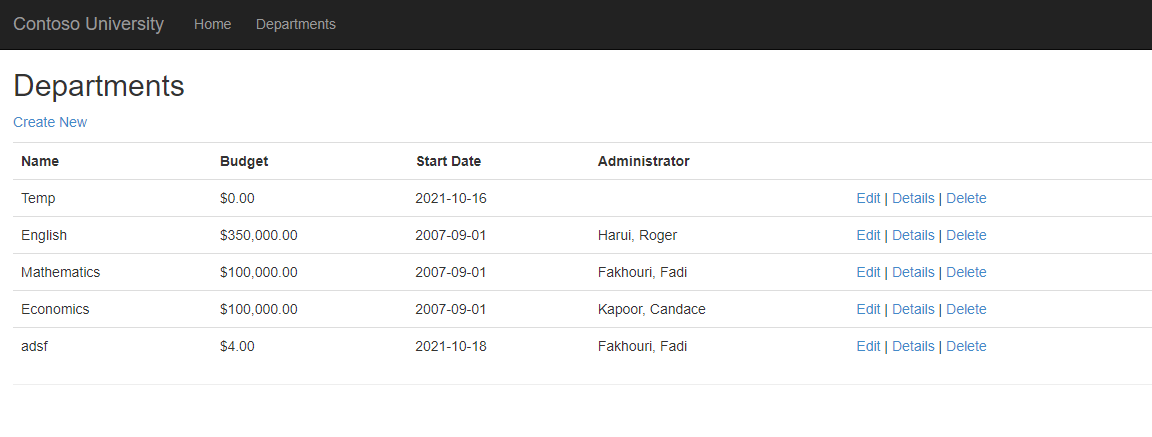
Once that list is displayed, the user clicks on a department’s Edit link to have the application retrieve the related Department object (again, through the Contoso University web service). The application then displays that object to the user for update. The code also retrieves a collection of instructor objects to populate a dropdown list displayed on the Edit page.
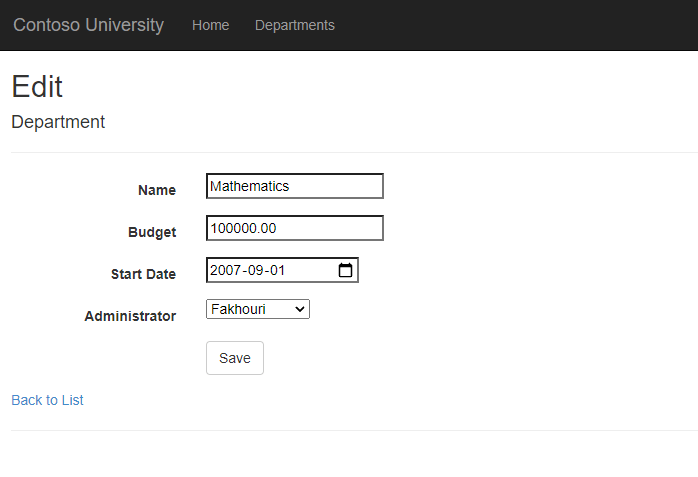
The user can then make whatever changes are required to the department data and click the Save button at the bottom of the page to have the application save the data through the web service. The application then returns the user to the list of departments.
My E2E test will exercise that functionality to prove that a user can successfully complete the transaction that integrates the web frontend and the web service backend to update a department’s information.
Step 1: Designing the Test(s)
Test Studio doesn’t change the process for creating your tests (the International Software Testing Qualifications Board probably has the most exhaustive—and exhausting—process). For example, at the very least, you’ll still need to:
- Decide what parts of your application require testing
- Do exploratory testing to make sure the application does work correctly
- Decide on the critical values you’ll use in your tests (equivalence partitioning)
- Put together a test script that proves the application works correctly with one set of critical values
- Execute the test
- Repeat the test with other critical values
For this case study, my test script will confirm that a user can:
- Access the list of departments
- Edit the English department’s information
a. Change the budget to $200
b. Change the start date to today’s date
c. Change the administrator to Zheng - Save the changes and return to the list of departments
- Confirm that all the changes were saved by accessing the department’s Details page
Step 2: Setting Up Your Project and First Test
For this case study, I’m going to assume that you’re using Test Studio itself (if you’re a developer, you can use the Test Studio Visual Studio plugin—installed with Test Studio—to create your tests). Before you begin, you’ll need, of course, to install Test Studio. You’ll also need to install the Progress Telerik Test Studio Extension on the browsers that you’ll be using for testing your application.
With everything installed, your next step is to create a Test Studio project to hold your tests: Start Test Studio, enter your project’s name in Web Project textbox and click the Create button next to the project name. I called my Test Studio project “Contoso University.”
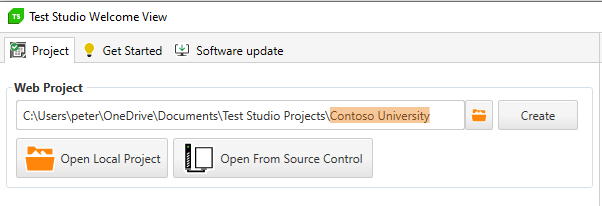
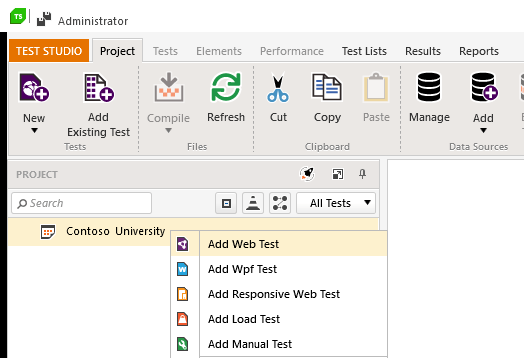
Once your project is created and opened in Test Studio, you can add your first test to the project: Right-click on your project in Project Explorer and, from the popup menu that appears, select Add Web Test.
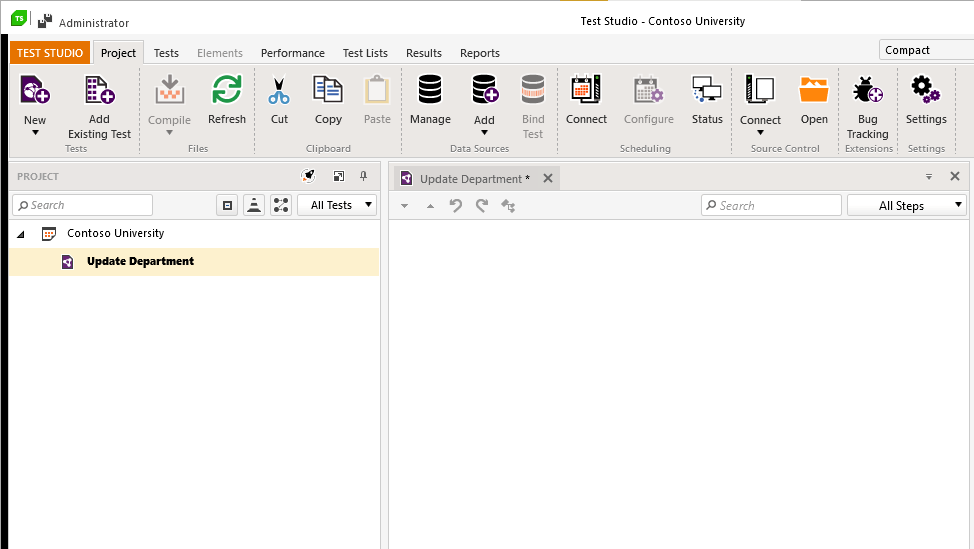
Once you’ve selected Add Web Test, your test is added to your project and appears in the Project Explorer list on the left side of Test Studio. You can now give your test a name (I called my test “Update Department”).
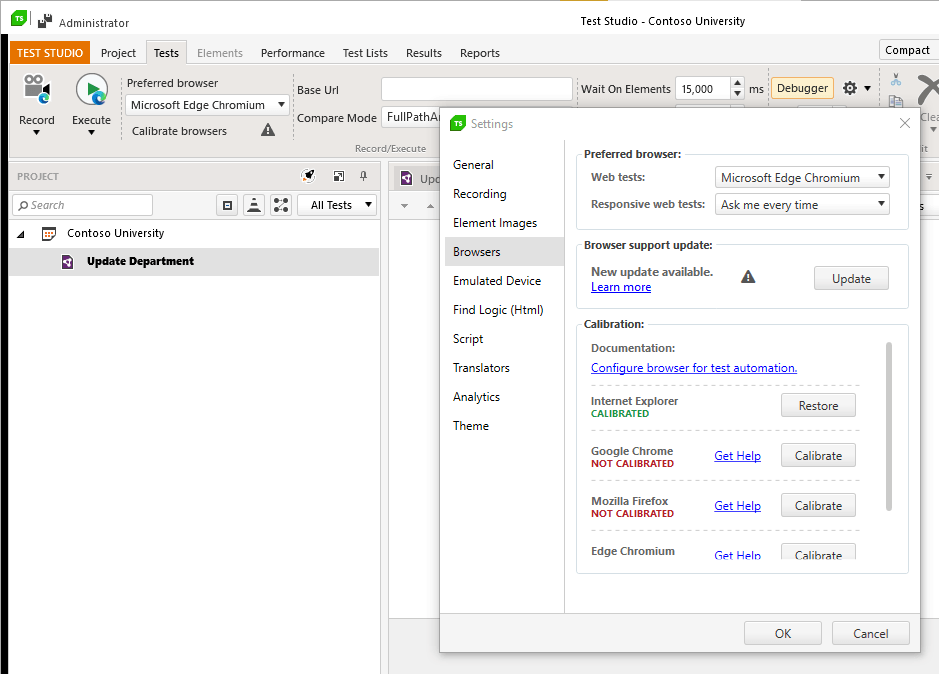
While it’s not essential, before you start your tests, it’s a good idea to let Test Studio have a look at your browsers and calibrate its settings for them. In the Test Studio window, click on the Tests tab and then on the Calibrate Browsers button. That opens a dialog that lists all the browsers that Test Studio will work with.
Any of those browsers installed on your computer will have a Calibrate button beside their name. Just click the Calibrate button beside any browser you want to use that’s flagged as Not Calibrated to let Test Studio finish setting up working with that browser. The process will close each of those browsers’ windows, so make sure you’re willing to give up those pages.
You’re now ready to record your first test.
Step 3: Recording the Test
The easiest way to create a test is to right-click on your Web Test’s name in Test Studio’s Project Explorer window and pick Record from the popup menu. That opens a dialog box where you can enter the URL for the start point of your test.
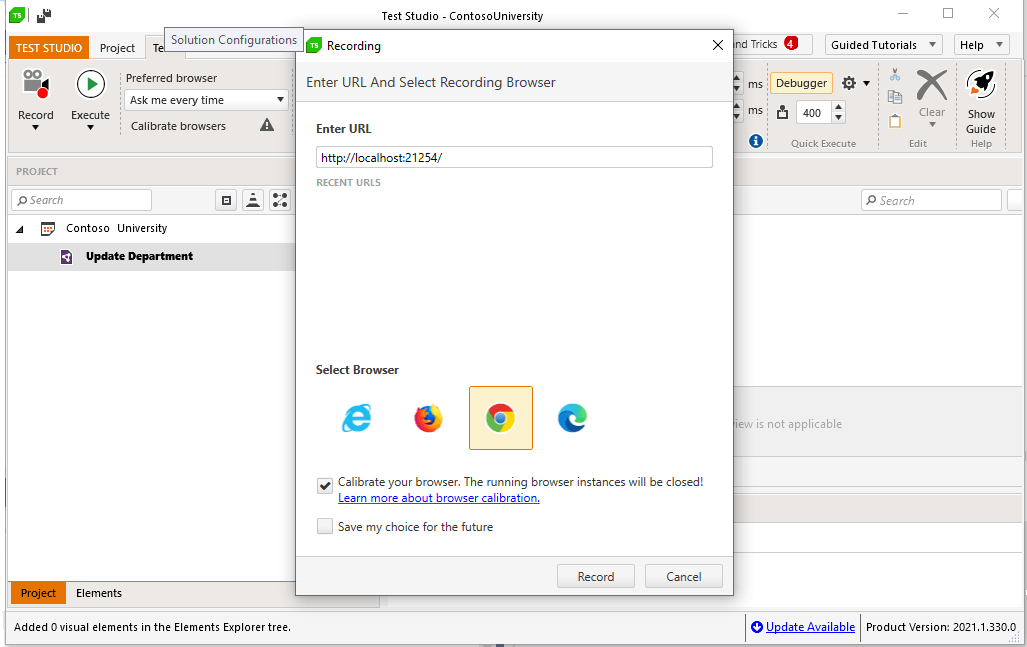
This dialog remembers URLs that you’ve used in the past so, if you need to create a new test at this URL, you can just select it from the dialog’s list. Again, Test Studio is going to close any open windows you have with the browser you select, so make sure you’re willing to give those windows up.
Once you’ve set the URL for the start of your test, you can pick the browser you want to use to record your test from the list of icons near the bottom of the dialog. Then click the Record button at the bottom of the dialog to start recording.
Test Studio will open the page at the URL you specified. You’ll notice a menu bar appear as the browser window opens.
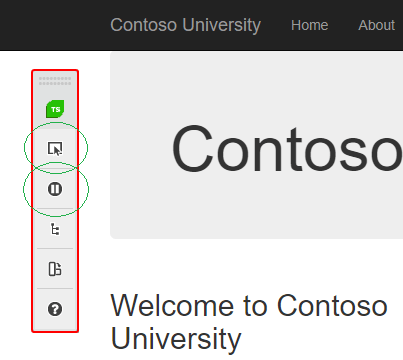
This recording menu is the link between your browser and Test Studio (it’s also a good signal to indicate that Test Studio is ready to start recording your test). There are some useful buttons on this menu—for your first recording, make sure that you know where the Pause and “Enable or disable hover over highlighting…” buttons are.
You can now work through your test script. As you interact with your pages, you’ll get visual feedback indicating that Test Studio has recorded your actions (for example, clicking on a link will display a black box with “Click” and the name of the link). You can also switch back to Test Studio to see your steps appear as you perform them. If you don’t get that visual feedback, don’t panic! You probably started before Test Studio was ready. Just go back to your initial page and start over.
Which leads to a key point: Don’t be concerned if you don’t execute your test script flawlessly. If, for example, you accidentally go to the wrong page and have to navigate back to the page you meant to use, don’t stop and restart your recording—just carry on with your test. Even if you miss a step in your test completely, you can fix all these problems later, as you’ll see. If you get interrupted, click the Pause button on the recording menu and resume your test when you’re ready.
Step 4: Verifying the Application
As part of your test, you’ll want to check that you were not only able to get to the right pages in your application but that the application did the right things on those pages (i.e. save changes to your data). The simplest way to check your results is, as part of your test, to surf to some other page in your application that shows the results of your changes.
In the Contoso University application, for example, each department’s Details page shows all the information for a department. As I record my test (and after updating the department information), I’ll surf to the Details page where all my saved test data should be displayed. Once there, I can use the data displayed on this page to check the results of my test.
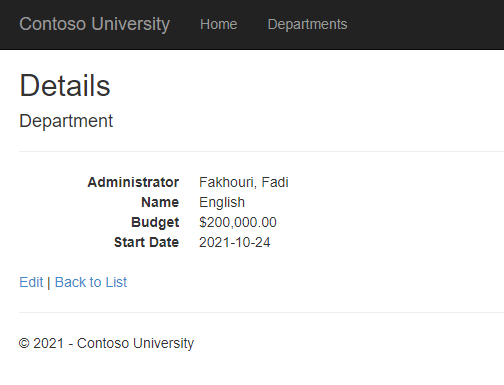
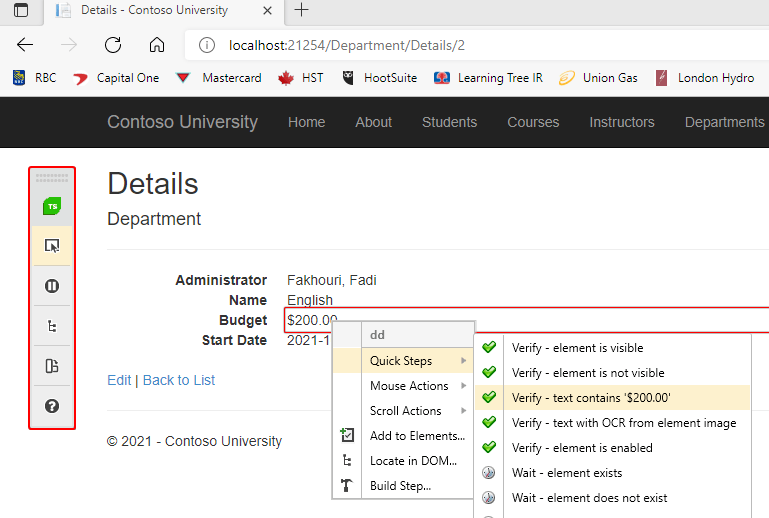
To capture data on a page to be used to check your results, click on the “Enable or Disable hover over highlighting…” option on the recording menu bar that appeared when you started your test. Then move your mouse to the element on the screen you want to use to check your result. As you do, Test Studio will highlight the currently selected element. In my case, I first want to check the Detail page’s Budget table cell, so I move my mouse until that element is highlighted.
When you highlight the data you want to use, a dropdown list will appear. From that list select “Quick Steps | Verify - ” to create what Test Studio calls a verification step. In my case, I pick “Quick Steps - text contains ‘$200.00’” to check that my change to the department’s budget was saved. You can then repeat that for any other items on the page you’d like to check. When you’re done, on the recording menu bar, click the “Enable or disable hover over highlighting…” button again to turn off highlighting so that you can continue to record your test run.
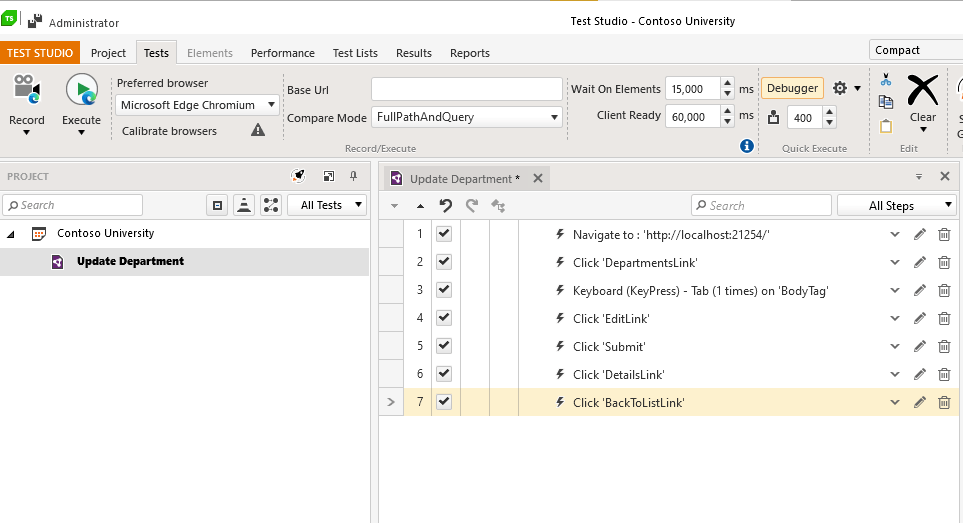
To ensure that you capture all the pages you need in your test, you may need to go “one page past” the last page you need in your test. For example, as part of my test, I might want to confirm that a user can return to the list of departments page after saving their information. To make sure that page is saved in my test run, after bringing up the list of department page, I would click on the link that returns me to the application’s home page.
When you’ve recorded everything you need, just close down the browser to end your test. After you close your browser, you’ll return to Test Studio. You’ll find all the steps you recorded in your test listed in your Web Test.
Step 5: Creating a Clean Test
Now that you have the steps from your test run recorded in Test Studio, you can review those steps and either delete any steps that aren’t necessary to your test or reorder them to get the “perfect” test.
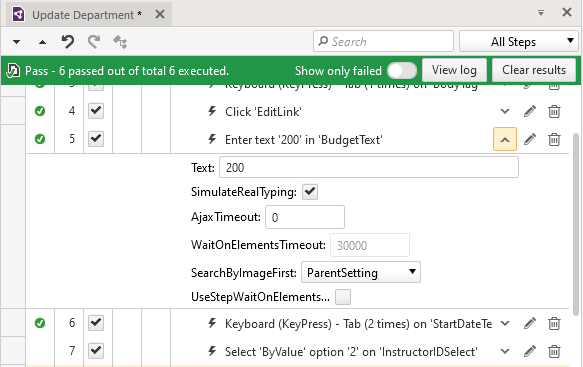
You can even change the content of individual steps. Individual steps have a down arrow that, when clicked, expands to show the detail for that step. Expanding the step that corresponds to entering some text allows you to review what was entered into a textbox and change it. If, for example, you discover that you entered the wrong data in a textbox, you can expand that step and change the Text textbox in that step to the right value. Now, when you run your test, your updated value will be used.
For dropdown lists, expanding the step reveals the value you selected during your test run. By default, the selected item is recorded ByValue in the SelectDropDownType field. That means that Test Studio used the hidden value associated with the choice you selected in its recording to record your choice. If you want to change that value and know the hidden value for the choice you want, you can just change the value in the step to the choice you want. If you don’t know the value, you can change the SelectDropDownType to ByText and enter the text displayed on the page for the choice you want.
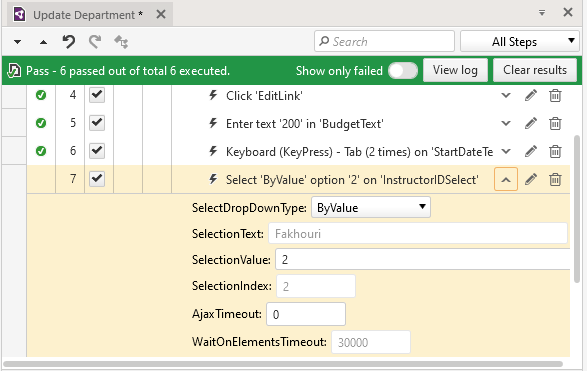
Do be aware that using ByText can be dangerous if the dropdown list’s content will be affected by, for example, internationalization. For my Edit Department page, ByText works because the dropdown list displays a list of instructor’s names. However, the text in a dropdown list that displays, for example, “High, Medium, Low” could vary from one locale to another.
Even if it turns out that you missed a step in your script, you don’t have to re-record the test. If you realize you’re missing one or more steps, then, in Test Studio, first find in your list of steps where you want to insert your missing steps. Once there, right click on the step before the “missing” steps and select “Run | To Here” from the popup menu. Test Studio will re-execute your script, walking the browser through to the step you selected, and then stop, waiting for you to continue. You can now resume executing your test script and Test Studio will fill in the missing steps as you execute them.
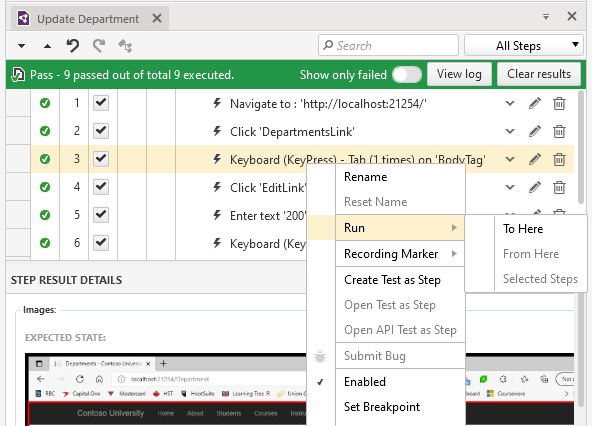
You can use this same process if you need to stop before you can finish recording your test. When you need to stop, shut down the browser to save your test and have Test Studio save your project to keep what you’ve recorded so far. When you return, you can use Run | To Here to run the part of the test you’ve recorded so far and then carry on from there to finish your test.
One last note on dealing with problems: The reality of HTML is that a) the specification is implemented in different ways in different browsers and b) developers are constantly innovating in how they exploit that specification. It’s all euphemistically referred to as “rich web content.”
While the Contoso application doesn’t provide many examples of the challenges of “rich content,” Test Studio can handle them. That includes HTML drag-and-drop operations, dynamically rewritten HTML, random JavaScript events, waits for a page to load as AJAX requests complete, and more (many described here with their solutions).
As an example in the Contoso application, I can leverage the datepicker on the Edit Warehouse page: In some browser implementations, the date you enter into the datepicker won’t be recorded by Test Studio.
However, Test Studio’s recorder will still add the datepicker element and the test code that manipulates it to your script. You can either enter the date into the element in your script or modify the script’s code. Because I’m a developer, I used the code-based solution: I right-clicked on the datepicker step, selected View Code from the popup menu and, in the resulting code window, commented out the line of code that mimics clicking on the textbox (it’s the first line of code).
If you want to try either of these solutions out, recognize that, by the time you read this, a new version of either your browser or Test Studio may have eliminated this glitch and you won’t have the chance to experiment.
Step 6: Running Your Test
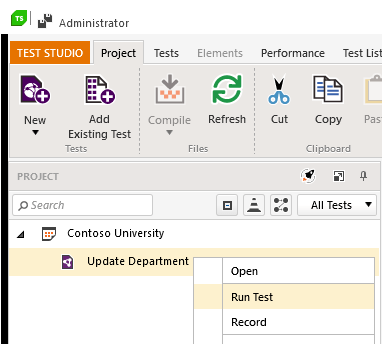
Finally, after you’ve finished editing your test (and you may not need to do anything), you can run it: Right-click on your test in the Project Explorer, select Run Test, and then sit back to watch Test Studio walk the browser through your test.
When the test is done (and assuming Test Studio found no problems), Test Studio will display a green banner that begins with the word Pass at the top of your test steps—always a good thing.
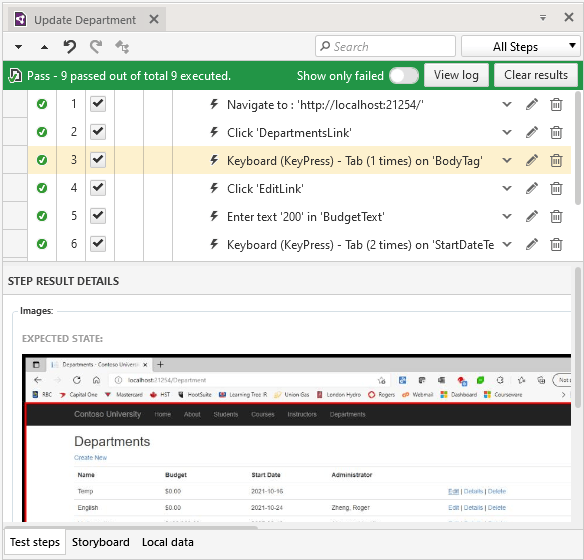
You’ll get different feedback if Test Studio finds a problem, of course. You can try that out in my sample application: To create a bug in my test case, I added a “Create bug” checkbox on the Edit Department page. When that box is checked, the budget amount entered on the screen is ignored and the budget for the department is set to zero. As part of my test run, I added a step to my test that sets or unsets the checkbox. To simulate a bug in my test, you can change that test step to have the checkbox set. If you do, then, when you run my sample test, the recording will still enter a value of $200 in the budget field but, when the test run gets to the verification step, the budget will be set to zero dollars and the verification step will fail.
Now when I run my test, it stops on the Verify “TextContent” step and waits for 15 seconds for the correct data to appear (just in case my page is just being slow). When the correct value doesn’t appear, my test is stopped and Test Studio shows my problem: A red banner appears at the top of my list of steps beginning with the word Fail and specifies how many steps completed successfully. The failing step will be highlighted and a Failure Details box is displayed with the step describing the error and providing multiple options for dealing with the failure.
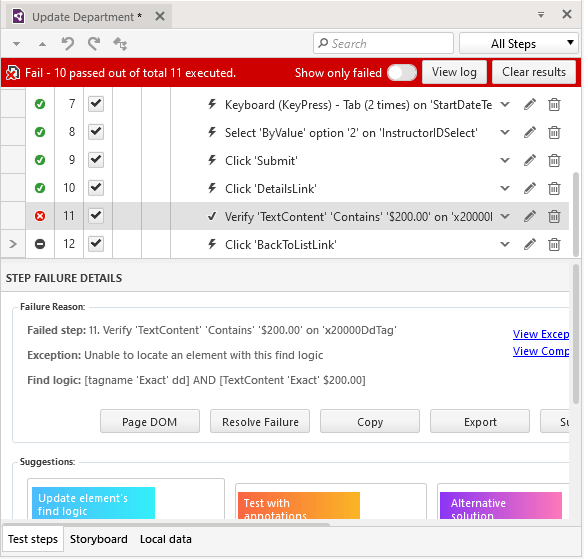
By the way, if you decide that a 15-second wait to check the result is unnecessary, you can turn that wait off, too. Just expand the verification step, select the UseStepWaitOnElements option, and set the WaitOnElementsTimeout to zero. You might as well get the bad news as soon as possible.
Step 7: Dealing With Failure
To understand what can cause Test Studio to report an error, it’s worth taking a look at the log file available from View Log button at the top of your list of steps. The relevant part of the log for my failed test looks like this:
'2021-10-24 10:18:15 AM' - 'Fail' : 10. Verify 'TextContent' 'Contains' '$200.00' on 'x20000TableCell'
------------------------------------------------------------
Failure Information:
~~~~~~~~~~~~~~~
Unable to locate element by Find Expression!
Attempting to find [Html] element using
Find logic
(Html): [tagname 'Exact' td] AND [TextContent 'Exact' $200.00]
Unable to locate element. Search failed!
As the log file the error message implies (“Unable to locate element”) when a test fails, there may not be a problem with my application logic—it may just be that Test Studio can’t find the element it’s supposed to check. That can happen because, for example, the element’s attributes have changed. Changed attributes might, of course, signal a bug in the code because altered attributes could affect both client-side and server-side processing. The Page DOM and Resolve Failure buttons in the Failure Details box can be helpful in determining the problem here.
However, changed attributes might also be an unimportant difference triggered by dynamically generated HTML. Test Studio provides several options for altering the conditions used in this verification to deal and can even deal with HTML that dynamically generates the ID attributes typically used to flag elements in your page.
If you determine that there really is a problem with the application (the usual case when a test fails), you can use the step’s buttons to share information about the failure:
- The Copy button lets you grab the information in the step to paste into a bug report.
- The Export button drops the error into a file to be pulled into some bug-tracking system or emailed to the appropriate person.
- The Submit Bug button will send the bug directly to whatever bug tracking system you’ve attached to Test Studio. (Test Studio supports Team Foundation Server and Jira out of the box, but you can create a plug-in for the system of your choice.)
You’ve now created your test, executed it, enhanced it and dealt with both success and failure. It’s time to start thinking about your next tests.
Next Steps
You may, for example, decide that your “next test” is really to run this test again but with a different set of data. Test Studio will let you do that without having to record a new test—just bind your test to a data source (which can just be an Excel spreadsheet).
It’s also possible that you may find that you can’t create every test you want using Test Studio’s recorder. If, for example, there’s no way to verify your test results by checking some page in your application, then you may need to create a coded module that will access the data in the database. That’s going to require some simple coding skills.
After you’ve got your test working, rather than create a new test, it’s tempting to extend your existing test into a larger one that checks lots of things. Don’t. Instead, create focused tests like the one in this case study that prove one business transaction works. Test Studio will let you put together test runs that combine multiple focused tests, each of which checks one of your application’s transactions. Having an inventory of lots of focused E2E tests is a better strategy than having one big test that checks everything.
And that’s really your next step: putting tests together and running them as often as you want in order to confirm that your application runs as expected. You could always return to Test Studio to re-run your tests. But the real power of having these automated tests comes from having them run automatically—you can do that, too.
Which means, not only can you now re-run your E2E tests whenever you want … you don’t even have to be there. That’s the best result of all.

Peter Vogel
Peter Vogel is a system architect and principal in PH&V Information Services. PH&V provides full-stack consulting from UX design through object modeling to database design. Peter also writes courses and teaches for Learning Tree International.
