Telerik Reporting
Report Designers Targeting .NET, Blazor, Angular and More
- Create interactive embedded dashboards, invoices and more with the help of 3 WYSIWYG report designers – Visual Studio, Web and Desktop, countless wizards, drag and drop support
- Complete .NET embedded reporting tool for web and desktop applications
- Supports: Blazor, Angular, React, ASP.NET Core, ASP.NET MVC, ASP.NET Web Forms, HTML5/JS, WPF, WinForms and WinUI.
-
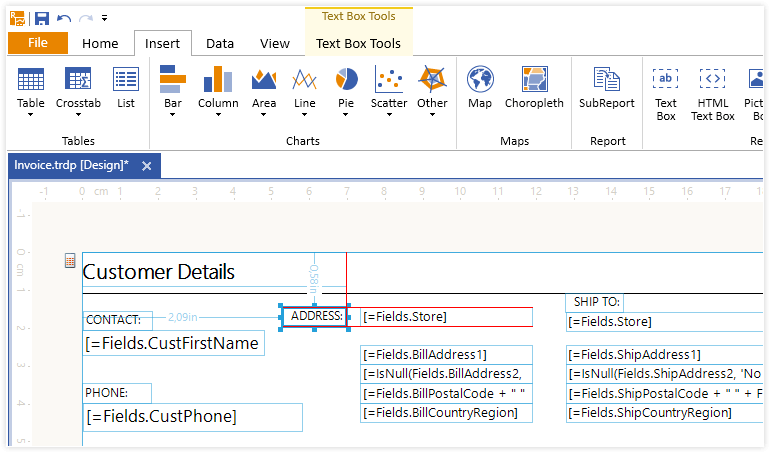
Standalone Desktop Report Designer
The Standalone desktop report designer, featuring an easy to use environment, is the heart of Telerik Reporting. It enables both developers and users to create, design, edit, preview, save, export and print ad-hoc reports seamlessly and without any code.
You can start from scratch with easy drag and drop design or use the huge library with predefined templates and many right-click menus for quick access to frequently used dialog boxes and commands.
Standalone report designer can be localized to display reports in the language of a specific region. The designer supports setting up the report for accessibility.
Learn more about Standalone report designer.
Getting Started with the Desktop Designers in .NET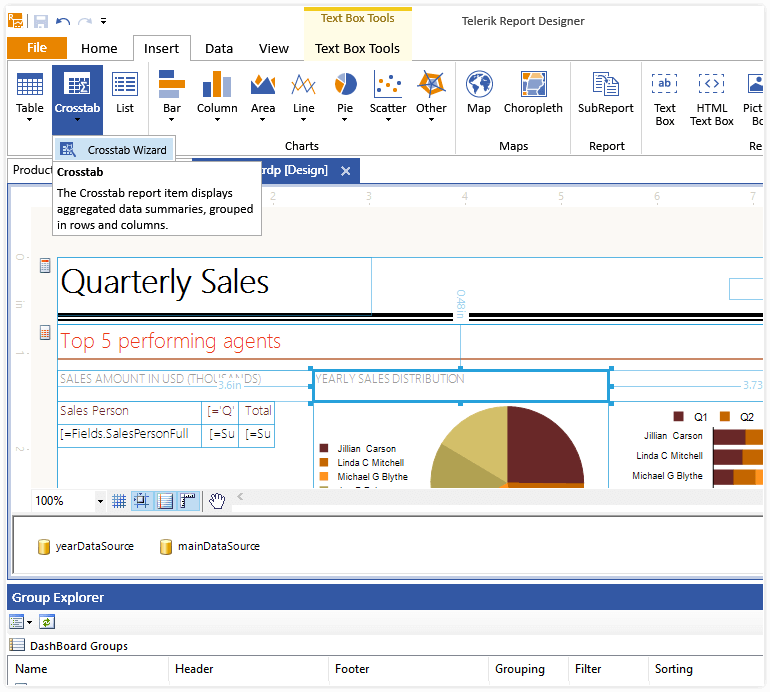
-
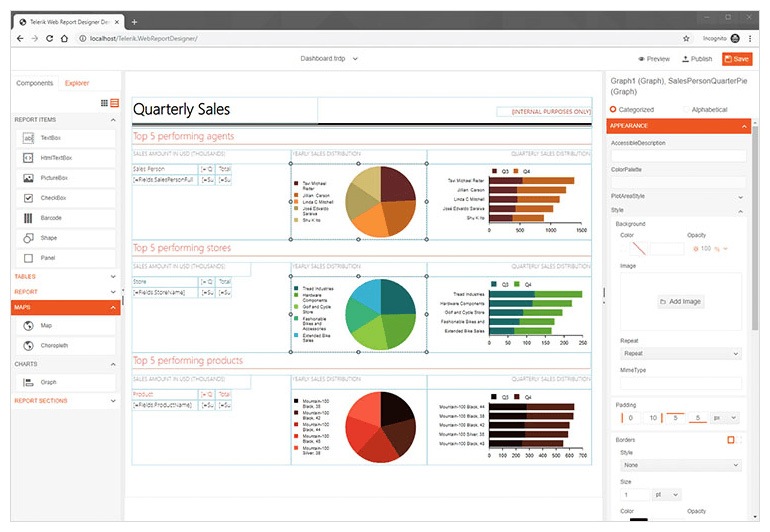
Web Report Designer
Web Report Designer, featuring an easy to use environment, is one of the latest gems of Telerik Reporting. It has fine-graded drag-and-drop functionality to layout and re-parent all items and sections. It has a toolbox to add a new item instance of all supported types. It has a Report Explorer pane that gives a great view of the report structure, plus it now incorporates the Data Source components into it. And finally, you have a well thought out Properties pane that is much more user-friendly than the one from the Visual Studio IDE that we are all accustomed to. Once done with the necessary edits, you can examine the rendered report using the built-in report preview functionality.
With the latest releases we have invested in the active development of the web report designer and now it is fully functional and on a par with the Desktop report designer.The Web Report Designer is now ready-to-use in all common and multiple advanced user scenarios, enhanced with the following features:
- Add full ObjectDataSource support to consume server-side business objects data. There is a Wizard tool to set it up flawlessly.
- Report definitions can now be uploaded from local files to your reports’ repository. The opposite is enabled as well, so you may download a server-side report definition to a local file.
- Multiple property editors got improvements and fixes.
- Add Bring to front / Send to back commands.
NEW: Embedded Reporting: With Telerik Reporting you’ll get a fully functional Web Report Designer that will help you to enable your business users to create, edit, style, view and export reports on their own. The reports can be easily embedded in any web or desktop application.
Learn more about Web-based report designer.
Getting Started with the Web Report Designer in .NET.Embedded Reporting: Enjoy Web Report Designer and seamlessly learn how to create, edit, style and view reports.
-
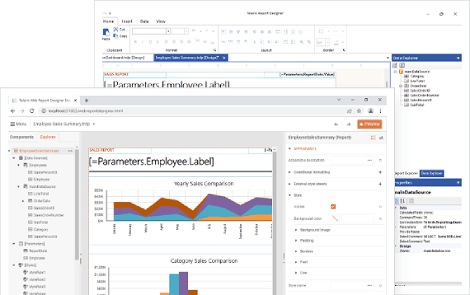
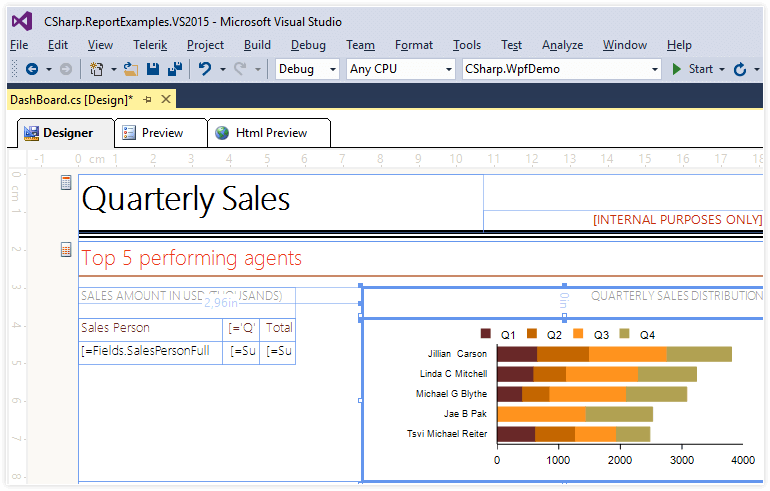
Visual Studio Report Designer
The Telerik .NET Report Designer for Visual Studio is specially created for developers that prefer VS for design reports. It works with .NET framework type report definitions (.CS or .VB files).
You can add and edit charts, tables and groups, fill them with data, calculate values, style, preview, share and export the ready reports. Report designer canvas simulates graph paper and represents the actual layout of the report elements as they would appear on a printed sheet of paper. It contains grid-lines, item snapping for perfect positioning, on-canvas item dimensions and pixel-perfect rendering.
You can localize the report using Visual Studio report designer.
Reports stored in a class library and are embedded and distributed in .NET framework or touch-enabled mobile applications.Learn more about Visual Studio report designer.
*Visual Studio 2010-2022 Compatible
-
Drag and Drop Report Creation
Telerik Reporting is the first reporting tool to provide a WYSIWYG report canvas. Used in both report designers, the canvas offers drag and drop item rearrangement, codeless data binding, in-line editing and many wizards and tools to help you create, design and edit reports faster than ever.
-
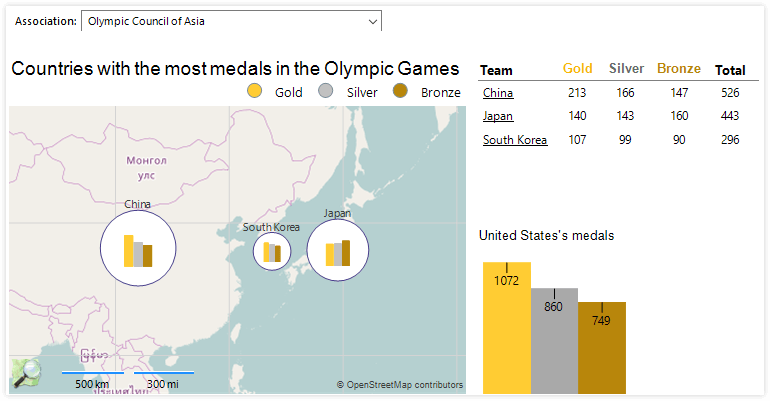
Maps, Charts, Crosstabs, Sub Reports and More
Telerik Reporting provides a full set of customizable interactive and data-aware items to help you build reports in a fast and efficient manner:
- OLAP crosstab, table, and list
- 20+ OLAP chart types, including sparklines
- Sub-reports
- 20+ barcode types
- Maps
- Picture box
- Panel
- Shape
- Textbox and HTML Textbox
- Checkbox
- Label
- Report, page, detail and group sections with headers and footers
-
Tools for Rapid Report Design and Beautiful Styling
Telerik Reporting is powered with report wizards, considerably simplifying your report setup. The wizards allow you to codelessly create reports, add data sources, manage interactivity, create charts, edit pivot groups, calculate values and style items.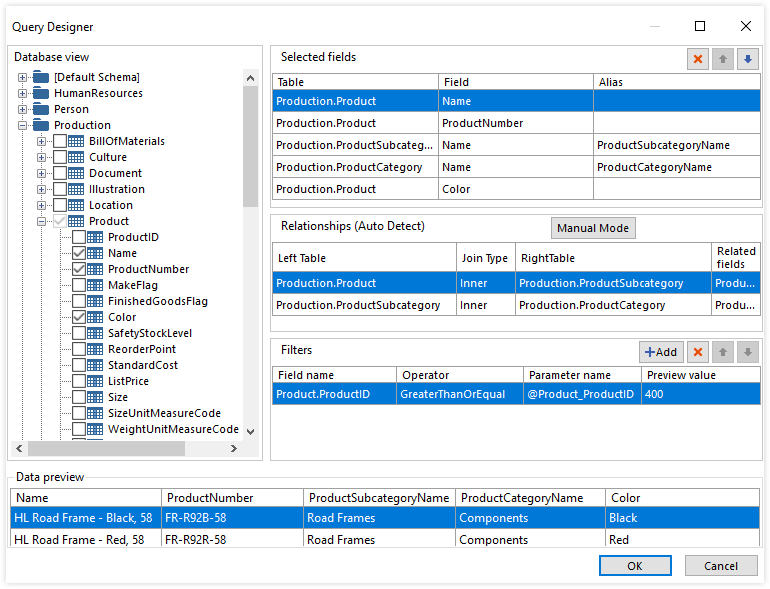
-
Complete API for Creating and Rendering Reports
Telerik Reporting provides complete programmatic control over your reports. Use the API to create, modify and work with reports, sections and report items with code.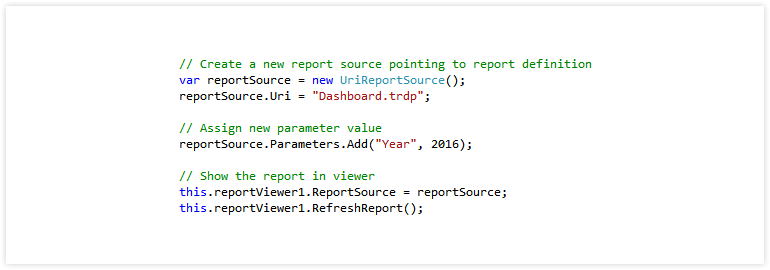
-
Reuse Legacy Reports
Telerik Reporting converts your existing reports from Crystal Reports*, XtraReports* and Active Reports* - in minutes in most cases - when you already have a reporting tool in place.
* Crystal Reports is a trademark of SAP; Active Reports is a trademark of Data Dynamics; XtraReports is a trademark of Developer Express Inc.
-
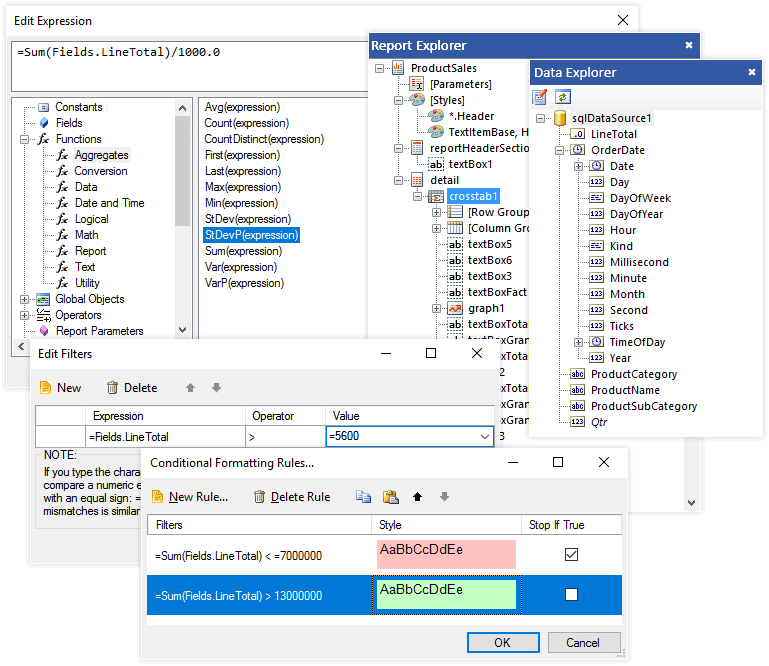
Quick Access to Report and Data Structure
In design-time, Telerik Reporting provides a Report Explorer and a Data Explorer which give you quick access and editing options to the report structure, parameters and filters, data sources and global styles.