
Telerik Reporting
OLAP Engine and Data Binding for Reporting
- Deliver relevant information from any data source (MS SQL Sever and Oracle, Web Services, ODBC Data Sources and more). Aggregate, filter and format data quickly and easily
- Complete .NET embedded reporting tool for web and desktop applications
- Supports: Blazor, Angular, React, ASP.NET Core, ASP.NET MVC, ASP.NET Web Forms, HTML5/JS, WPF, WinForms and WinUI.
-
High-Performance OLAP Data Engine
The intelligent Telerik OLAP data engine utilizes server resources to process the report data. It then transfers data needed by the report to the client and stores it in memory. This means optimized CPU loads and a decreased memory footprint on the server, with near-instant data access on the client. -
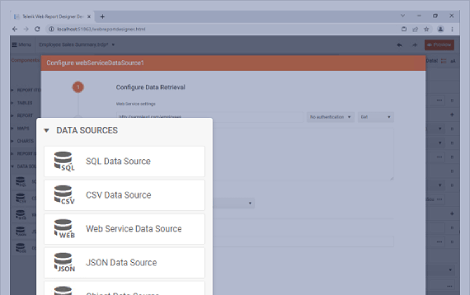
Data Source Support with Codeless Data Binding
Telerik Reporting provides design-time, data source components to help you codelessly bind report items to several data sources simultaneously. This includes Microsoft SQL Server Analysis Services cubes, ADO.NET data sources, relational databases, business objects, ORMs and XML. Programmatic data binding (at run-time) is also supported.
Learn the best practices for data retrieval in Telerik Reporting. -
Full Control Over Your Data Through Expressions
The task of writing expressions is simplified with the Excel-like expression engine. There is no need to write code, or event handlers. The Telerik expression engine allows you to:
- Group, filter and sort data at all report levels
- Aggregate and calculate data
- Limit the data retrieved from the data source
- Define master-detail hierarchies
- Merge data-driven information (mail merge)
- Bind report parameters and item properties to an expression
- Create reusable expressions and aggregate functions and more
Frequently Asked Questions
-
What is Embedded Reporting?
Embedded Reporting makes it exceptionally easy for any business user to create, edit and visualize reports inside other business applications. The involvement of developers is kept minimal—just during the initial integration of reporting. Then, business users can take the helm. In a nutshell, embedded reporting saves time for developers and simplifies the overall process of data visualization for business users. Learn more.
-
How can I design a report?
You can easily create beautiful reports with one of the three WYSWYG report designers included in Telerik Reporting: Standalone Desktop Report Designer, Web Report Designer and Visual Studio Report Designer.
-
What is Visual Studio Report Designer?
The Visual Studio Report Designer offers a "What You See Is What You Get" (WYSIWYG) canvas for report generation, which allows users and developers to add and edit charts, tables, and other report items, style them, feed them with data and add calculations. Item rotation, in-line editing, report zooming, drag-and-drop data binding and a slew of additional features are also available directly in the report designer. To make the process of accurate positioning, aligning and sizing of report elements easy and intuitive, Telerik Reporting implements some techniques used in drawing software, such as gridlines, item snapping for perfect positioning, on-canvas item dimensions and report panning. Using this designer enables developers to handle events straight into the report definitions for maximum customization of the report.
-
What is Standalone Desktop Report Designer?
The Standalone Desktop Report Designer offers a "What You See Is What You Get" (WYSIWYG) canvas for report generation, which allows both users and developers to add and edit charts, tables and other report items, style them, feed them with data and add calculations. Item rotation, in-line editing, report zooming, drag-and-drop data binding and a slew of additional features are also available directly in the report designer. To make the process of accurate positioning, aligning and sizing of report elements easy and intuitive, Telerik Reporting implements some techniques used in drawing software, such as gridlines, item snapping for perfect positioning, on-canvas item dimensions and report panning.
-
What is Report Engine?
A report engine is a software component in reporting tool responsible for generating, formatting, and delivering reports based on input data and predefined templates or criteria. It acts as the backbone of reporting systems, handling the process of collecting, organizing, and presenting information in a structured manner. Report engines typically incorporate features such as data aggregation, filtering, sorting, and visualization to create comprehensive reports tailored to the needs of users. These engines often support various output formats, including PDF, Excel, HTML, and others, allowing flexibility in how the generated reports are consumed. Additionally, report engines may offer scheduling, automation, and distribution capabilities to streamline the reporting workflow and ensure timely delivery of information to report users.
-
What is Report Designer?
A report designer enables users to create, customize, and format reports from data stored in databases, spreadsheets, or other sources. This tool often provide a user-friendly interface with drag-and-drop functionality, allowing users to design the layout, structure and appearance of their reports. Report designers typically offer a range of features such as data filtering, grouping, sorting, and visualization options to help users present their data effectively.
Telerik Reporting is a reporting tool featuring 3 report designers - Visual Studio, Web and Desktop, countless wizards and drag and drop support.
-
How does Embedded Reporting work?
With Embedded Reporting developers will be able to simplify the workload by enabling their business users to easily create, edit and view reports on their own. The business users could use user-friendly Web report designer for report authoring and editing. Additionally, they could preview reports in web and desktop apps or print them. Learn more.
-
What is Web Report Designer?
The Web Report Designer is designed with the sole purpose of providing web report-editing capabilities to your web applications. It can be embedded in any web application—the only requirement is to host the accompanying REST Service in a .NET framework or a .NET Core application.
The Web Report Designer provides a design surface that allows the users to place, move and resize the report items in an easy and intuitive way. It preserves the most important features known from desktop designers like in-line editing, re-parenting through drag-and-drop or snapping to grid and snap lines. The report items representation utilizes Progress KendoUI widgets, ensuring silk-smooth user experience. The dedicated REST Service provides live preview for the complex report items, showing exactly how they will look when the report is rendered. Redesigned layout of the tool windows allows for easy navigations through the report items and their properties.
-
What are the benefits using Telerik Reporting?
Telerik Reporting a complete, lightweight, easy-to-use, and powerful .NET embedded reporting tool for web and desktop applications that supports: ASP.NET Core, Blazor, ASP.NET MVC, ASP.NET AJAX, HTML5, Angular, React, Vue, WPF, WinForms, WinUI. With Reporting tool any developer or reporting user will be able to create, style, view and export rich, interactive and reusable reports to attractively and beautifully present analytical and any business data. The reports can be added to any web and desktop business application through report viewer controls. The ready reports can be exported in more than 15 formats.
-
Where can I find Telerik Reporting examples and demos?
Telerik Reporting has handful sample demos, covering multiple reporting scenarios. The sample demos are designed to demonstrate the power of Telerik Reporting tool. You can review and play with them.
-
What is Web Reporting?
Web reporting refers to the practice of generating and presenting reports, data analyses, or visualizations through web-based platforms or applications. This approach allows users to access and interact with reports conveniently via web browsers, eliminating the need for specialized software or installations. It enables organizations to consume information quickly, collaborate remotely, and provide report users with real-time insights into various aspects of their business operations or projects.
-
What is the difference between Report Designer and Report Builder?
The difference between a Report Designer and a Report Builder lies primarily in their functionalities and target users:
Report Designer: This is typically a more advanced and feature-rich tool aimed at developers but also at their end users. Report designers often provide a comprehensive set of tools for creating complex and highly customized reports.
Report Builder: Report builders are generally designed for beginners who need to quickly create basic reports without delving into complex design or development processes.
Professional looking reports always require to be built with report designers. Telerik Reporting is a reporting tool featuring 3 report designers - Visual Studio, Web and Desktop, countless wizards and drag and drop support. Telerik Reporting enables report creation for both - developers and end users.
Why Choose Telerik Reporting
Enjoy a Complete Feature Set
Telerik Reporting lets you create, view and export rich, beautiful, interactive and reusable reports - everything a lightweight, feature-complete and embedded reporting tool should do.
Create Interactive Reports with .NET Report Designers
Create interactive embedded dashboards, invoices and more with the help of the Visual Studio, Standalone Desktop or Web WYSIWYG report designers, countless wizards and drag and drop support.
Customize .NET Reports Styling to Your Needs
Design great reports with the help of perfect item positioning, CSS like styling with themes, conditional formatting and more.
Deploy Reports to Any ReportViewer Control
Add reports to any business application. View reports in web, desktop and cloud apps. Export reports to any format (15+ supported formats).
OLAP Engine and Data Binding for Reporting
Deliver relevant information from any data source. Aggregate, filter and format data quickly and easily.
Embedded Reporting: Turn Users into Report Creators NEW
Simplify your workflow with an intuitive embedded reporting tool that enables your business users to easily create, edit and view reports on their own.
