UI for ASP.NET AJAX
ASP.NET AJAX Chart (HTML5)
- Visualize data with the rich selection of ASP.NET AJAX Charts, suitable for any use case.
- Part of the Telerik UI for ASP.NET AJAX library along with 120+ professionally designed UI components.
- Includes support, documentation, demos, virtual classrooms and more!
-
Any Essential Chart Type
Quickly add meaning to data with the most commonly used ASP.NET charting types:
- Pie or Donut chart to visualize each piece of data as part of a whole
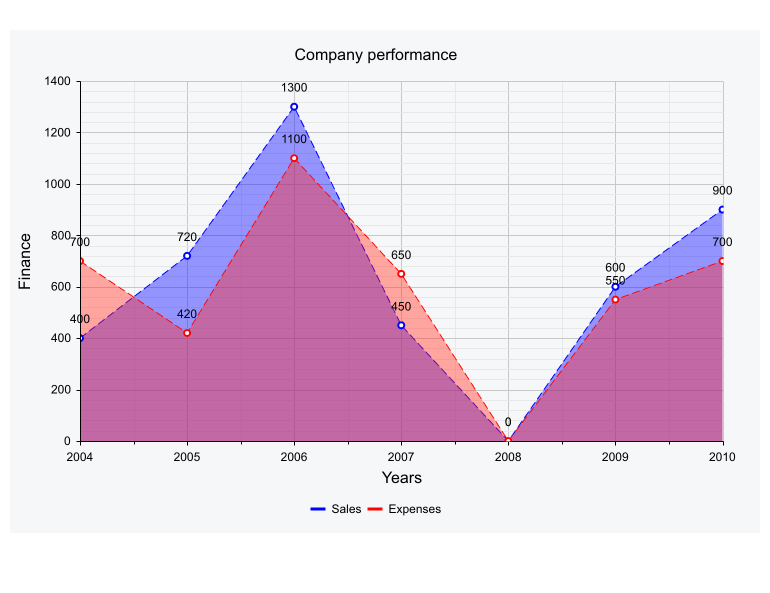
- Line or Area to monitor trends
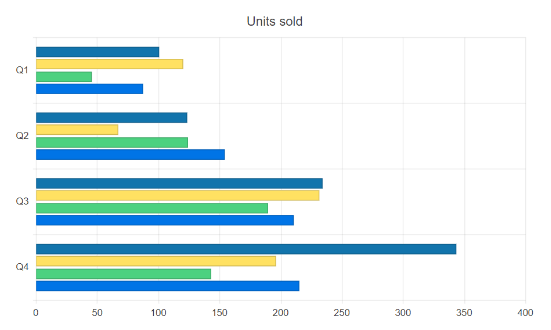
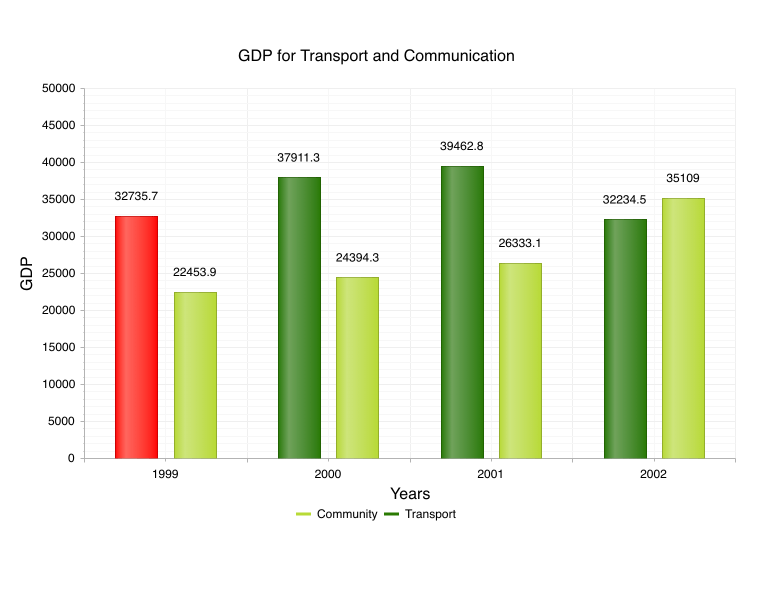
- Bar, Column or Radar to compare several sets of data
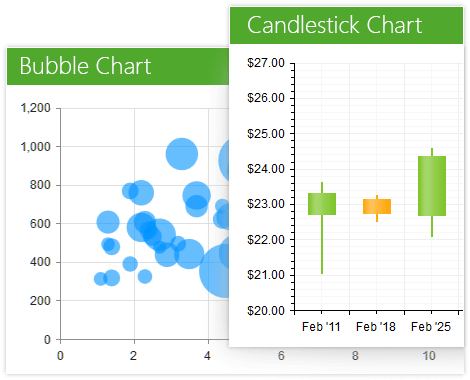
- Scatter, ScatterLine or Bubble to visualize the correlation in a set of engineering data
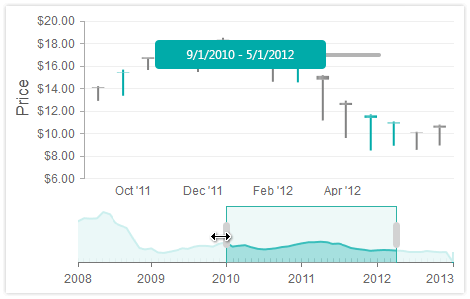
- Candlestick to keep track of your financial performance
- Box Plot to graphically depict your statistical data
- Funnel to represent the stages in a process
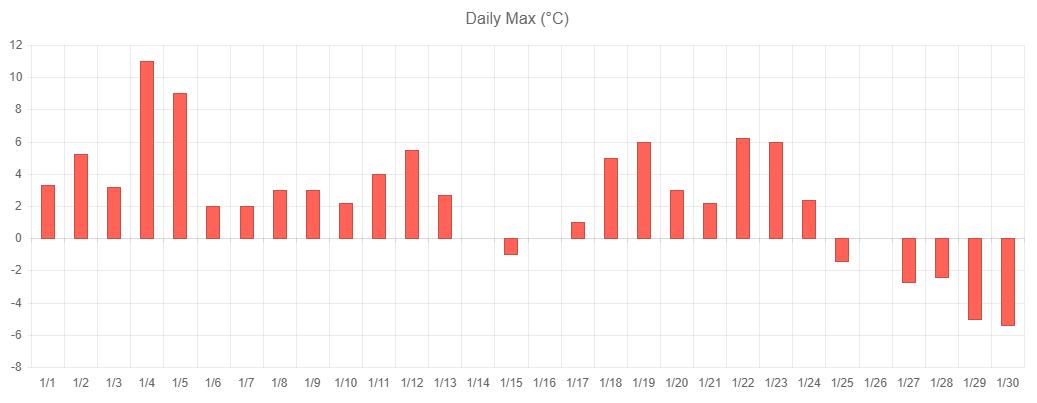
- Waterfall to represent cumulative effect of consecutive positive or negative values
- Polar to plot engineering data in a polar coordinate system
- Sparklines to provide context to your data
Line series can have Spline or Step Line appearance:
- Spline curves help you make trends more evident
- The Step Line setting is useful for visualization of intermittent discrete data
-
Toggle the Highlight Effect When Hovering
Programmatically toggle the highlight effect of any series when needed, as for example to build effects or to let users trigger it with a click of a button. Check out how on the demo page (go to Series Settings and play with the highlights radio list).
-
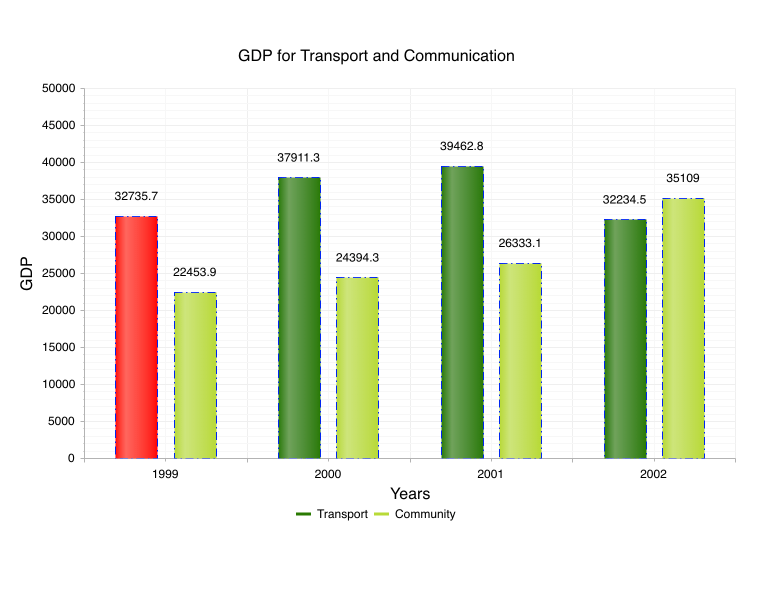
Reverse Legend Items Order
The order of the items in the chart’s legend can be reversed if necessary. See more about the chart legend configuration options on the dedicated demo page.
-
Appearance Settings for Series Border and Tooltip
You can modify the width, dash type, color and opacity settings of series borders and tooltips. The various options to configure how the chart border series work can be seen on the demo page (Series settings -> Borders section on the right).
-
ASP.NET AJAX DashType Property
The Area, Line, ScatterLine, PolarLine, PolarArea, RadarLine and RadarArea charts have a DashType property which controls how the chart lines, x and y axes and the major and minor grid lines will be rendered—solid, dashed or dotted.
-
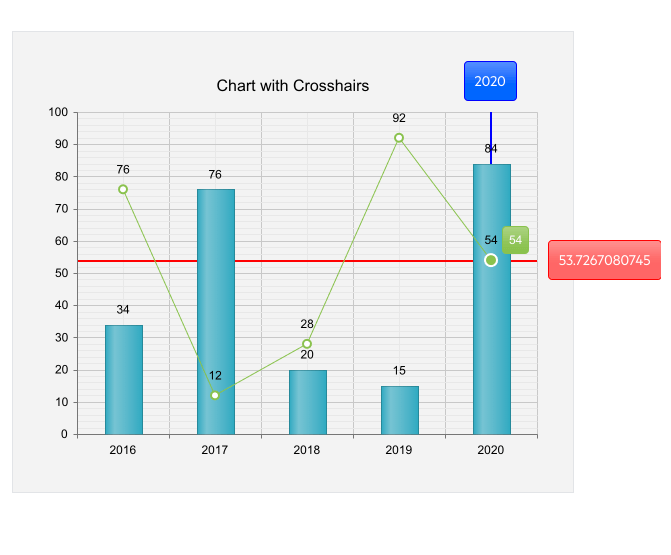
Crosshairs
Allow users to read the exact value of a data point centered at the current mouse position with the Crosshairs feature of the Chart.
-
Define Axis Label Position
Developers now have the ability to define axis label position in RadHtmlChart. With the ability to define label position, developers have the flexibility and ability to deliver an optimal UX with their ASP.NET AJAX Chart.
-
Support for Various Data Types
You can feed various data types into the chart. Depending on the chart type, numerical data can be distributed on the X-axis over other numbers, categories (strings) or points in time (DateTime).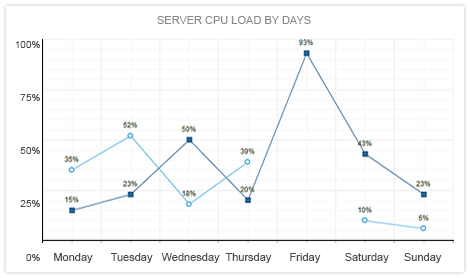
-
Zoom and Scroll Data Displayed Over Time
Data Navigation functionality lets you zoom and scroll data displayed over time. You can easily navigate price movements of financial instruments with Candlestick series, trends with Line series, and sets of data with Area and Column series.
-
Built-In Skins to Style Your ASP.NET AJAX Chart
Use a single property to apply any of the 20 ready-to-use built-in themes to create a consistent look for your apps, while saving design and front-end development time. You can additionally customize the chart elements in the markup.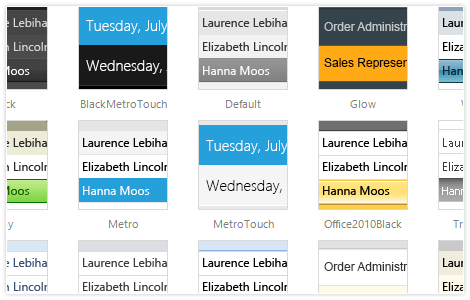
-
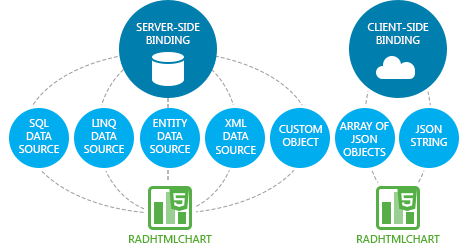
Data Binding: Server-Side and Client-Side
Use just a few properties to bind the Telerik ASP.NET AJAX Chart to the data source that suits your project best, be it a declarative ASP.NET DataSource control, such as SqlDataSource, LinqDataSource, EntityDataSource, XmlDataSource, etc., or programmatically on demand to DataSet, DataTable, or any other custom object. Show additional fields in the tooltips or labels by defining your own client template.
You can also use a JSON string or an array of JSON objects to change the datasource of the control on the client.
-
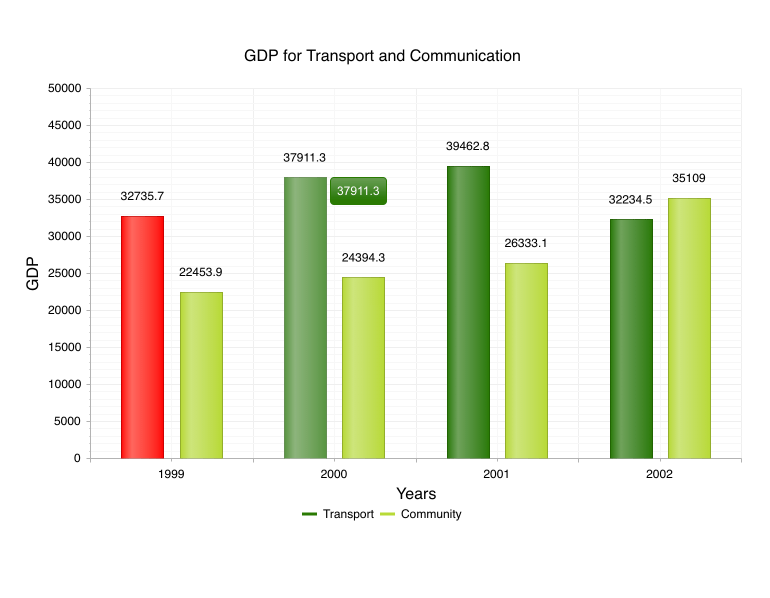
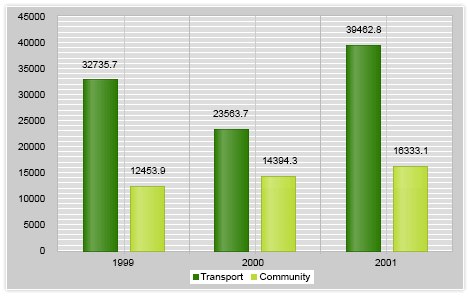
Multiple Series and Combination Charts
RadHtmlChart gives you the freedom to display a number of series together and combine multiple similar chart types to achieve a comprehensive visualization of your data.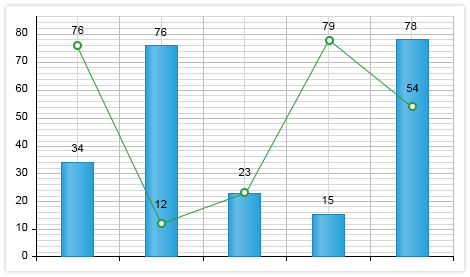
-
Printing and Exporting
Have your browser print only the chart, not the whole page. Leverage InkScape, an open source SVG editor, to export the visualized data. -
Ease of Use Thanks to Intuitive Markup Structure
The Telerik Charting component for ASP.NET AJAX is designed with ease of use in mind. The markup structure closely resembles the actual structure of a chart to make it more comfortable. Detailed customization is usually done with inner tags, which enables better feature separation instead of flooding one tag with a myriad of properties.
-
Rich Server-Side API
Easily modify every aspect of the chart configuration, including colors, sizing, animations, etc. The intuitive server-side API of the Telerik Chart allows you to easily create the chart programmatically. This makes the control easily adaptable to a myriad of scenarios. -
User Interactions with Animations and Highlighting
RadHtmlChart features built-in animations for smoother user experience and highlighting on hover for an enhanced data presentation and ease of use. Hovering over a series name in the legend highlights the entire series in the chart, while clicking on it toggles its visibility, so users can concentrate on important data. -
Easy-to-Customize Appearance and Alignment
You can either use the automatic axis setup and layout adjustment to have the Telerik ASP.NET AJAX Chart decide how to best position its elements or take advantage of the built-in customization options for the axes, labels, tooltips, title, legend, etc. and quickly alter the alignment and appearance yourself.
You can also take advantage of the exposed color properties and set conditional formatting to your chart series.
-
Client-Side Events for Maximum Flexibility
Respond to user actions or build upon the core chart functionality by handling the client-side events triggered upon hovers and clicks on the series. Use the exposed arguments to implement custom features, such as drill-down. -
Visual Studio Integration and Design-Time Support
Install Telerik UI for ASP.NET AJAX, the suite containing RadHtmlChart, to get the control available in your Visual Studio Toolbox. Drag and drop it onto the design surface and use the SmartTag, the Properties Window or the Design-Time wizards to codelessly configure the control and make it fully functional. -
ASP.NET AJAX Chart Mobile Support
Why should you build a mobile version of your application when the same app can work equally well on mobile and desktop devices? Thanks to its modern rendering, RadHtmlChart works across all devices and handles touch events in the same manner as those triggered by a keyboard or a mouse.
-
Cross-Browser Support
When using the control in your apps, rest assured it behaves as expected and has a consistent look and feel in all browsers used.
Read the full list of supported browsers
-
Client-Side Rendering for Better Performance
ASP.NET AJAX Chart is rendered entirely through JavaScript, thus reducing the amount of work performed on the server. Instead of rendering the entire image on the server and sending its markup to the client, the engine sends only the serialized data, which ultimately boosts the performance of your application. The control is powered by Scalable Vector Graphics (SVG), allowing animations and interactivity in modern browsers with a fallback to Vector Markup Language (VML) for older browsers.
-
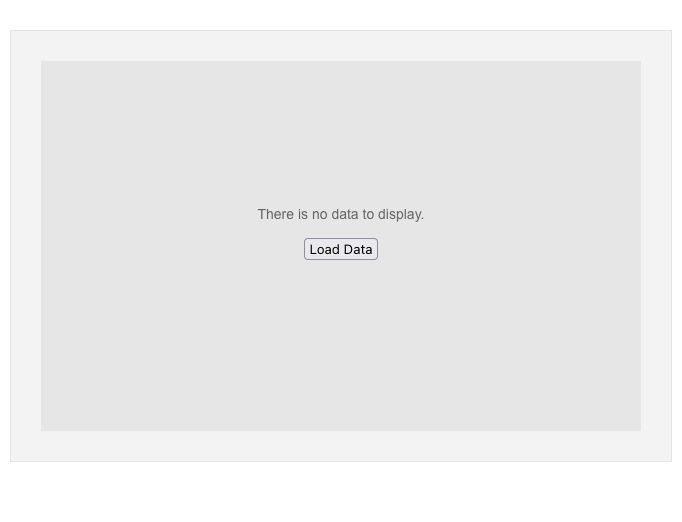
No Data Template
The Telerik UI for ASP.NET WebForms Chart supports a No Data template, allowing you to display custom content when no series are defined or all series are empty. This feature is enabled via the NoDataTemplate property, giving you a flexible way to inform users when there’s no data to visualize.
See the Telerik UI for ASP.NET AJAX Charts no data template demo
-
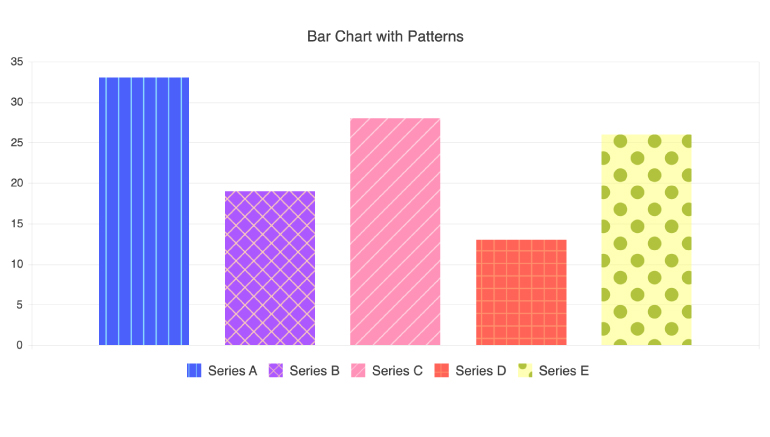
Chart Patterns
The customization options of the Telerik UI for ASP.NET AJAX Charts also include support for using patterns in chart series. The series patterns can be used to visually differentiate the chart series when the case requires.