
Adding Group Headers and Subtotals with the Embedded Web Report Designer

Data becomes more useful when you apply some analysis—generating useful subtotals, for example. It’s even more useful when you can group your data so you can find what you need. You can do all of that in the Embedded Web Report Designer.
When the Progress Telerik Web Report Designer is embedded in one of your applications, you can create the ideal report: The report with the data you need in the application where you need it. Once you’ve created that report, you can access it whenever you return to the application.
After you’ve started creating a report and adding data to it, you’ll want to organize that data. That’s going to mean sorting the data, grouping that sorted data, adding inline headers to identify those groups of data and including group totals and grand totals.
In a report on Products, for example, it would be useful to have the data grouped by the Product’s Category field. That way:
- All the products in each category will be displayed together
- A group header identifying the category could be displayed at the start of each group
- A subtotal of the total units in the category could be displayed at the end of each group
Creating a Group
To create a group, you need to select field the report should use to group your data. Once you select that field, the report will automatically sort your data by the field and add a group header and footer for each group to your report to hold headings and subtotals. Now, when you display your report, whenever the value in your grouping field changes, the report will insert your group header and footer around the grouped data.
To select your grouping field:
- Switch to the Explorer tab in the panel on the left of the designer and, at the top of the panel, select the top line in Explorer (it will be the name of your report) to select your report as a whole.
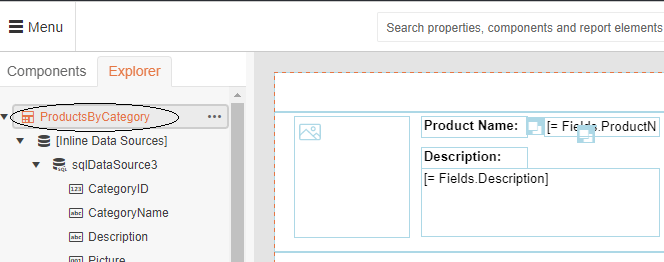
- Now switch to the panel to the right of the designer and expand the Data section to show the Groups property.
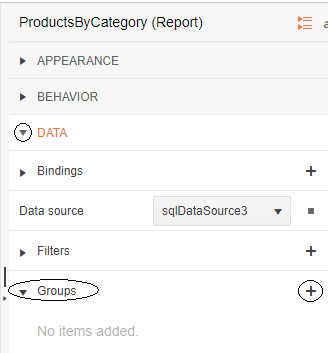
- Click the plus sign to the right of the Groups property to display the Add New Item dialog.
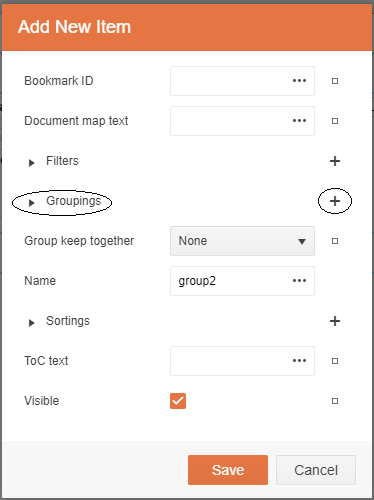
- In the Add New Item dialog, find the Groupings property and click the plus sign to its right. That will display another Add New Item dialog.
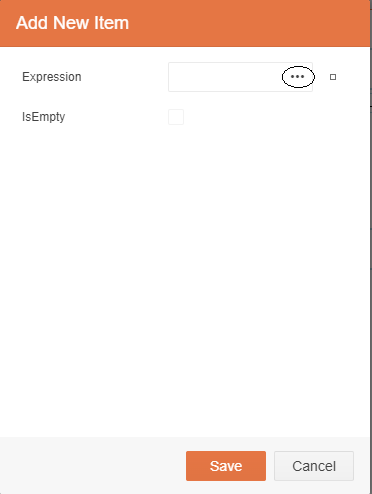
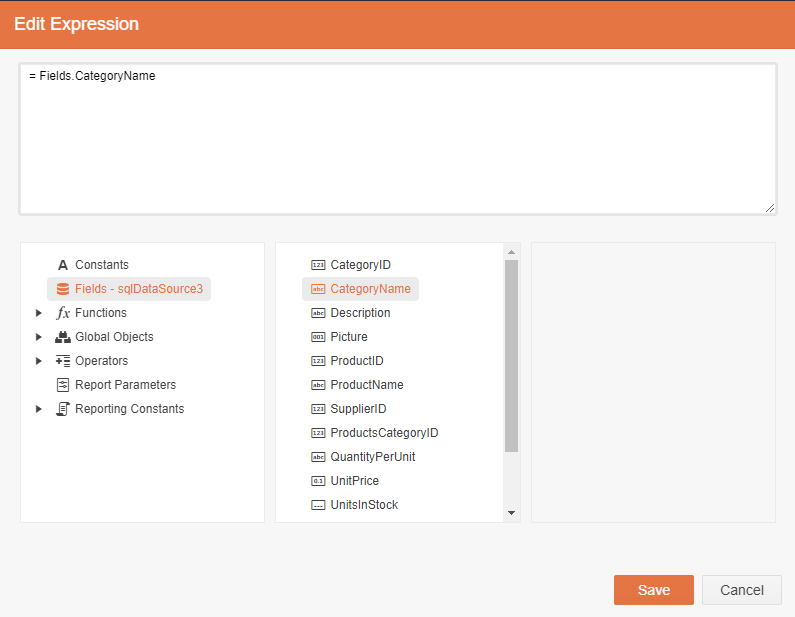
To the right of the Expression textbox, click the three dots to display the Edit Expression dialog. The Edit Expression dialog is where you’ll select your grouping field.
In the lower left list in the Edit Expression dialog, click on Fields to display a list of fields in your data. Then double click on the field that you want to use as your grouping field (in this graphic, the data is going to be grouped by CategoryName).
Now that you’ve selected your grouping field, just click the various Save buttons to close all those dialogs. When you get back to your report, you’ll find you have two new sections (a group header and a group footer) surrounding your detail section.
Hint: By the way, you can always get back to the top level of your report provided you’ve got something selected in the designer: Just keep pressing the escape key and your selection will “back up” through the hierarchy until your whole report is select (a glance at the panel on the right will show you when you’ve arrived but the escape key will stop “backing up” when you get to your report).
Adding Labels to a Group Header
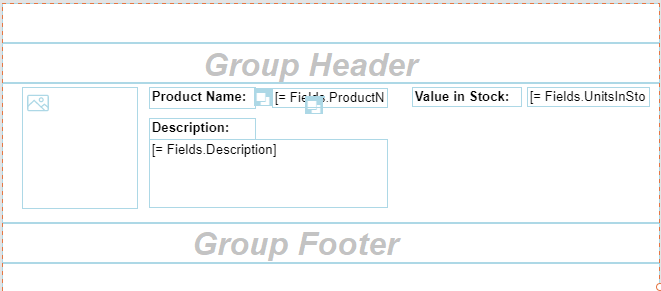
Once you’ve added a group header, you can add a label to the header to display the group field’s value whenever the group changes. In a Product report grouped by Category, for example, you’d probably want to display the CategoryName at the start of each group.
To add a label that displays the current group’s value, from the panel on the left of the designer select the Components tab, find the TextBox component and then drag the TextBox onto your group header. In the panel on the right of the designer, expand the Appearance section, and scroll down to the Value property.
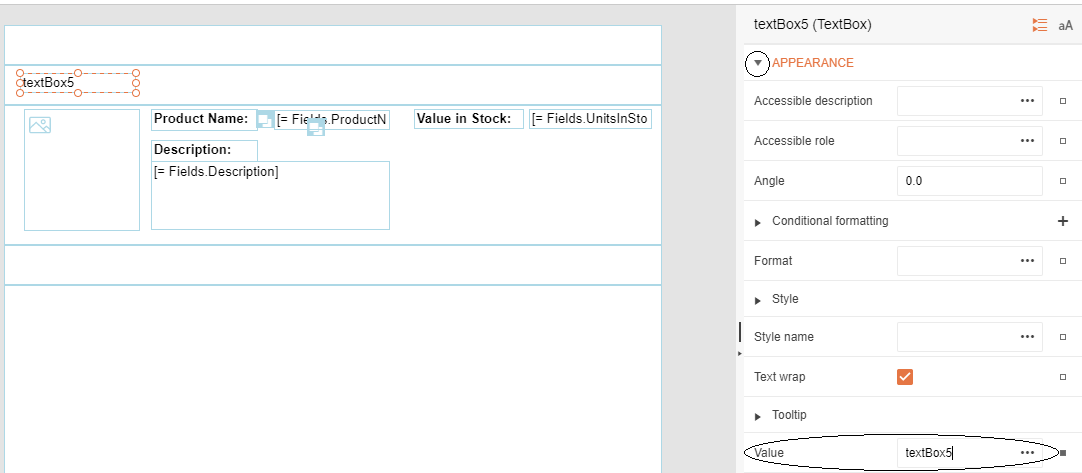
Click on the three dots to the right of Value item to display the Edit Value dialog and, in the list on the lower left, select the Fields entry to display the list of Fields. In the list of Fields, double click on the field you want to use to identify your group (in this example, that’s the CategoryName field).
Click the Save button to update your header. Now, when you preview your report, you’ll have a label at the start of each group that displays the group’s shared data (in the example, that’s the name of each category).
Subtotals
Typically, you’ll use the group footer to display subtotals. That means adding a TextBox to the group footer, setting the TextBox’s Value property to an aggregation function like Sum or Average, and specifying which field is to be aggregated.
Start by dragging a TextBox from the Components tab on the left of the designer into the group footer. In the panel on the right, expand the Appearance section to show the Value property. Now click the three dots to the right of the Value to display the Edit Value dialog.
To select the kind of subtotal you want:
- In the list in the lower right, expand the fx Functions list to get a list of the different kinds of functions available to you.
- Select the Aggregates category to display the list of aggregate functions (these functions include sum, average, min, max and more).
- From the list of aggregate functions, double-click on the kind of subtotal you want. That aggregate function will be added to the textbox at the top of the dialog (in this example, the Sum aggregate function has been selected).
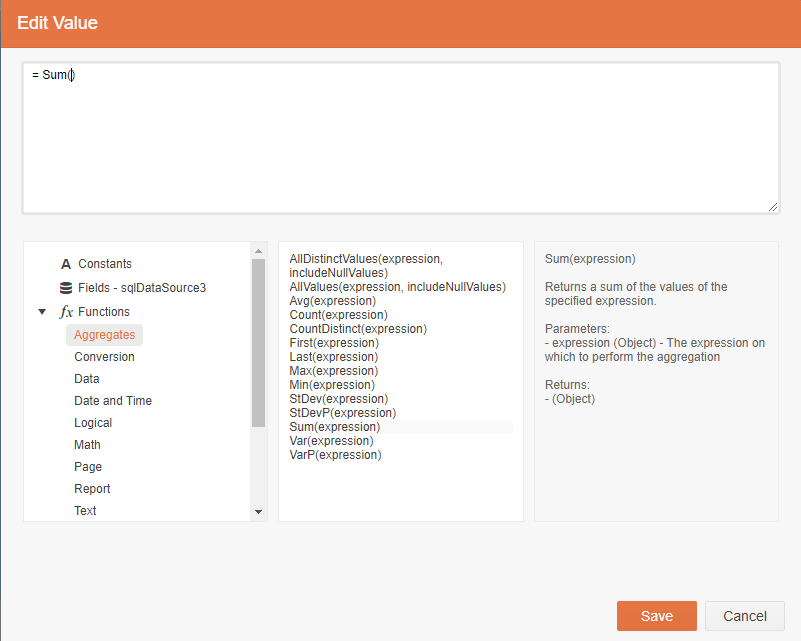
- To specify the field to be subtotaled, in the list in the lower right of the dialog, click on the Fields item to display the list of fields in your data source.
- Double-click on the field you want to be aggregated.
Selecting the Sum aggregate function and the UnitsInStock would create this formulate in the textbox at the top of the dialog:
= Sum(Fields.UnitsInStock)
Click on the Save button to close the dialog—you’ve now added a subtotal to your group footer. If you preview your report, you’ll see your subtotal at the end of each group with whatever aggregation you selected (you might want to add a label to the footer to identify the subtotal).
Hint: If you have problem with getting the aggregation formula right then, before you start selecting your aggregate function and field, erase everything in the textbox at the top of the Edit Value dialog. After you’ve cleared that textbox, try double-clicking on the aggregate function and then on the field you want. Or, if you’re feeling brave, just type in your formula instead of selecting items from the various lists.
Next Steps
There’s more you can do here, of course. You can, for example, drag Report Header and Report Footer components into your report. If you add TextBoxes with aggregate functions to your Report Footer section, those TextBoxes will automatically display grand totals for your whole report.
But, now, you’ve not only got a report that you want in the application where you need it, you’ve also got the data in the order you need, in the groups that make sense to you, and with the subtotals that will let you make good decisions. That’s pretty much the ideal report.
Ready to Take Advantage of Embedded Reporting?
Progress Telerik Reporting provides all the tools you need to embed the rich, interactive reports your users need in order to analyze and understand their data right into your users’ applications (including letting your users export the results into more than 15 formats, either to distribute or integrate with other analysis tools). Telerik Reporting then lets you go further and empower your users with a fully functional Web Report Designer to create the reports they want without ever leaving the applications where they’ll use their reports.
You can leverage these easy-to-use tools in both any client-side web application environment (HTML5/JS, Angular, React, Vue or Blazor) and any .NET application (web or desktop: ASP.NET Core, ASP.NET MVC, ASP.NET AJAX, WinForms and UWP).
If you still have not tried it, you can start a free trial to take a closer look. A renowned support service and an array of resources will help you along the way.

Peter Vogel
Peter Vogel is a system architect and principal in PH&V Information Services. PH&V provides full-stack consulting from UX design through object modeling to database design. Peter also writes courses and teaches for Learning Tree International.
Related Posts
Comments
All articles
Topics

Latest Stories
in Your Inbox
Subscribe to be the first to get our expert-written articles and tutorials for developers!
All fields are required