
Reading and Interacting with Embedded Telerik Reports

Telerik Embedded Reports can be delivered to you right inside your application—and you can do a lot more those reports than just “read them.”
You have a variety of ways for interacting with a Telerik report that’s integrated with your application—everything from “just reading it” to changing the data included in the report.
Be aware, though: Some of what you can do will depend on how the report was created and how it was embedded into your application’s UI. As a result (and as with any application), to get the everything you want from a Telerik report, it’s a good idea to make your needs known to the development team (or create the report yourself).
Telerik reports are displayed using the Progress Telerik Report Viewer, which is actually a suite of report viewers, each of which supports a specific environment and development tool. Most viewers are built around the Telerik HTML5 Report Viewer—if you’re viewing your report in a web browser, that’s the viewer you’re probably using rather than the specialized versions for desktop applications.
Fortunately, all the members of the suite look very much alike, though you’ll find some variation depending on the application, where you’re viewing the report and what features the report developer has enabled. Here, we’ll focus on the HTML5 Report Viewer in all its manifestations and with all of its features.
The tool for interacting with your report is the toolbar at the top of the report:

Navigating in and Between Reports
Near the left end of the menu (after skipping over the first two icons) are loading and navigation icons that you probably recognize and can use without any more discussion. Those are the icons to stop loading, reload the report, go to report’s first page, go to previous page, go to a page number, go to the next page and go to the last page.
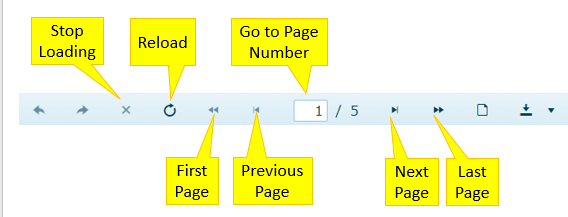
The first two icons on the menu are special, though, and will be enabled as you move from one report to another in the Report Viewer (i.e., if your report is part of a set of reports—a “report book”—or you follow links in one report to another report). These buttons let you move forward and backward through the reports you’ve visited.

If you are working with a report book, you don’t need to use the navigate forward and backward buttons though: If you keep clicking the “next page” button, you’ll—eventually—page through all the reports in the report book.
A report book may also include a table of contents as the first report in the book and that table of contents will let you select the report in the report book that you want to view. You may also find links within a report that will take you to another, related report in the report book you’re viewing.
Finding What You Want
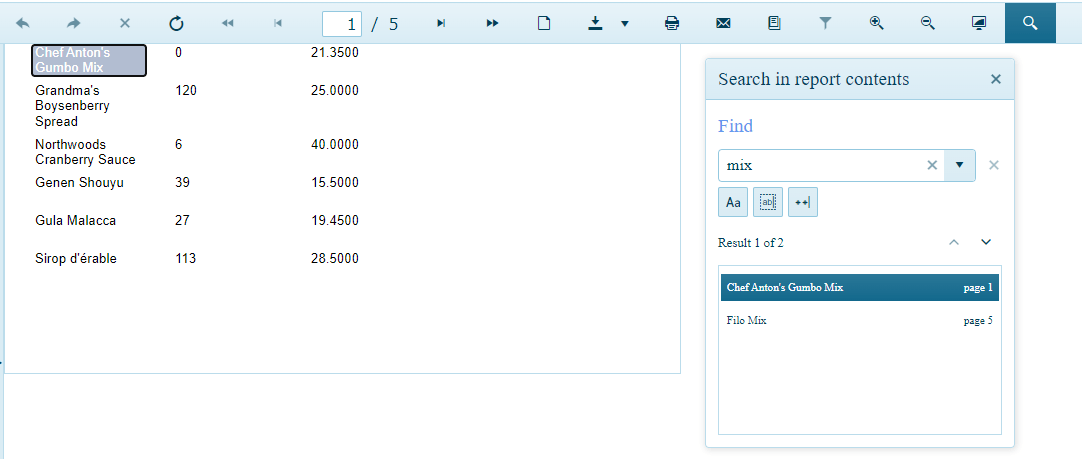
In a large report, paging through a report may not be the most efficient way to find the information you need. If you know the particular item that you’re looking for, you can use the search icon at the right end of the menu bar to open the Report Viewer’s search window. Entering some text in the search box will give you a list of every place in the report where that text appears and show you that text in context. Search options let you list lines by partial word, whole word and regular expressions.
After you’ve generated your list, you can then select the line you want in the search results window to navigate to that part of the report (though that may not be necessary—you’ll already have been taken to the first appearance of the text in the report).
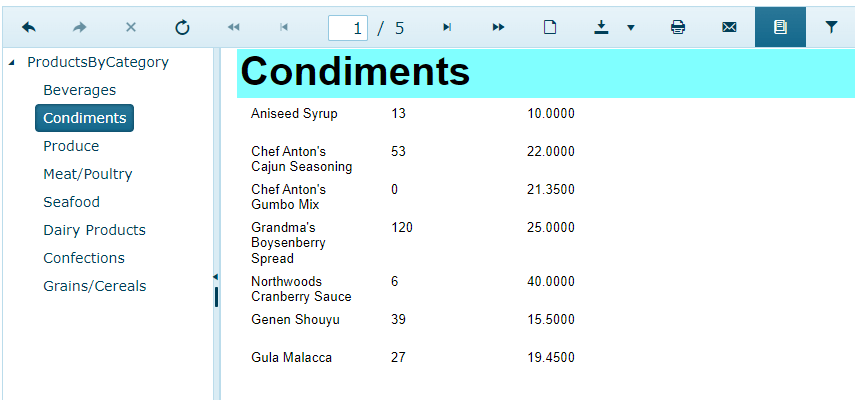
You may have another tool for getting around within the report: the document map. In the report viewer menu, just to the right of the print icon is the icon that opens your report’s document map. Clicking that icon will display the document map for your report (or maps for a report book) to the left of your report. Once you expand the map tree, you’ll get a list of parts of the report that you can navigate to. If your report doesn’t include a document map (or the map doesn’t list the sections you’re interested in), talk to your report developer about adding a map.
Viewing, Exporting and Printing the Report
When it comes to viewing the report, there are additional icons that you’ll find useful (and you will probably also recognize). This includes, for example, the print preview icon that shows you the report as it will look if printed (by the way, all the features of the report viewer still work in print preview mode).
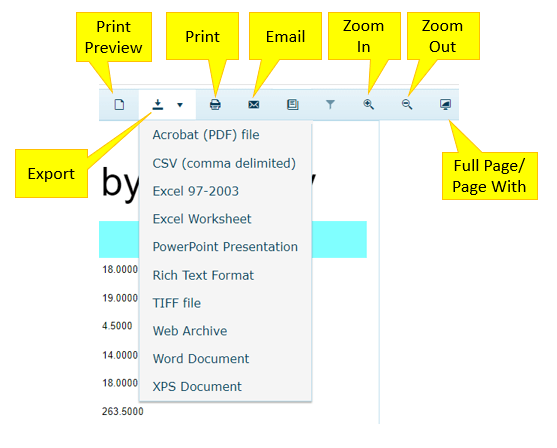
The icon to the right of the print preview icon lets you export your report to a wide variety of formats (see the graphic for the complete list). The icon to send your report to the printer (which often includes a PDF option) is just to the right of the export button. The next icon will let you email the report as an attachment with your choice of the format for the attached report.
Further to the right are the buttons that will let you zoom in and zoom out. Further to the right again is an icon that looks like a monitor that lets you switch between two different widths: A “full screen” view and a “printed page” view.
Changing the Report
The report that’s initially displayed to you may not always be the report you want. The report developers may, for example, have provided a report that’s tightly coupled to the data being displayed by your application. Alternatively, the initial display of the report may give you a broader overview of data related to what your application is currently working with.
However, your report developers may also have given you the ability to change the focus of your report—you may be able to change the focus of your report by changing the parameters that control what the report displays. You can view those parameters by clicking the funnel/filter icon in the report viewer menu. Clicking that icon will display a panel on the right that shows the available parameters you can work with.
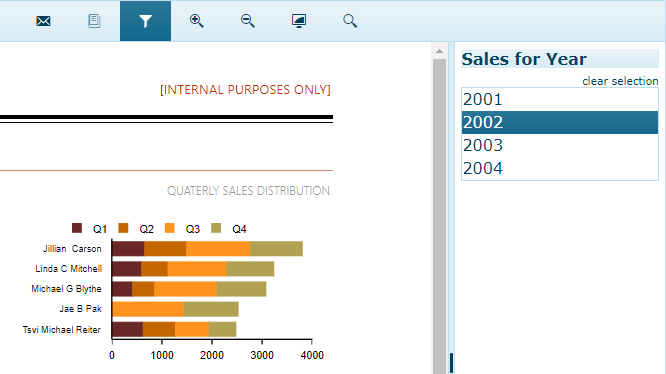
You may find that you have a single parameter with a list of values to select from or a set of several parameters whose values you can mix and match. As you probably expect, picking a parameter from this list (or lists) will update the report to reflect your choice—that can let you zero in on a particular area in the report other than the initial view. There may also be “select all” and “clear all” options at the top of the list that will let you get a broader view of the data.
In a report book, the parameters you’re given will be assembled from the parameters for all the reports in the book—changing any of these parameters will update all the parameters of the reports in the book so that you get a consistent story as you move through the various reports in the book.
The story here is that your report isn’t just “for reading”: You’re in charge. Depending on how your report has been implemented and embedded, you can navigate within the report, move between reports in a report book, find the data that matters to you, and even change the data displayed in the report.
Ready to Take Advantage of Embedded Reporting?
Progress Telerik Reporting provides all the tools you need to embed the rich, interactive reports your users need to order to analyze and understand their data right into your users' applications (including letting your users export the results into more than 15 formats, either to distribute or integrate with other analysis tools). Telerik Reporting then lets you go further and empower your users with a fully functional Web Report Designer to create the reports they want without ever leaving the applications where they'll use their reports.
You can leverage these easy-to-use tools both in any web and desktop applications: Blazor, ASP.NET Core, ASP.NET MVC, ASP.NET AJAX, WinForms, WPF, Angular, HTML5/JS, React, Vue.
If you still have not tried it, you can start a free trial to take a closer look. A renowned support service and an array of resources will help you along the way. Support is free during your trial. Telerik Reporting is also available in DevCraft bundles.

Peter Vogel
Peter Vogel is a system architect and principal in PH&V Information Services. PH&V provides full-stack consulting from UX design through object modeling to database design. Peter also writes courses and teaches for Learning Tree International.
Related Posts
Comments
All articles
Topics

Latest Stories
in Your Inbox
Subscribe to be the first to get our expert-written articles and tutorials for developers!
All fields are required