
Adding Charts and Creating Dashboards in the Web Report Designer

Summarize with AI:
It’s true: Nothing converts data into useful information faster and with more impact than a good visual. You can add the chart (or charts) you need to the reports available from your application using the Embedded Web Report Designer.
The ideal report gives you the data you need and, when the report is embedded in your application, gives you that data where you need it.
Sometimes the data you need is best expressed visually: as a chart or even as a set of charts—a dashboard. Only you know what visual input you need to support how you use your application and, with Progress Telerik Web Report Designer embedded in your application, you can create that visual input without leaving the application where you’ll use the report.
Before you add a chart to your report, you’ll have selected at least one data source. A single data source may be all you need but, if you want to create a dashboard, feel free to add more data sources to your report to support all the charts that you want.
Adding Your Chart
After you’ve added your data source(s) to your report, your next step is to select the chart that you want and drag it into a section in your report.
If you’ve been creating reports by dragging and dropping fields into your report’s Details section then you know that everything in your Details section is repeated for every row in your data source. However, you probably don’t want your chart to be displayed more than once in your report. You have two ways of preventing your chart from being repeated:
- Make sure that your report isn’t bound to your data source. In the Explorer tab on the left of the designer, select the top line (it’s the line with your report name). In the panel on the right, expand the Data section and make sure the Data source dropdown list is set to (none).
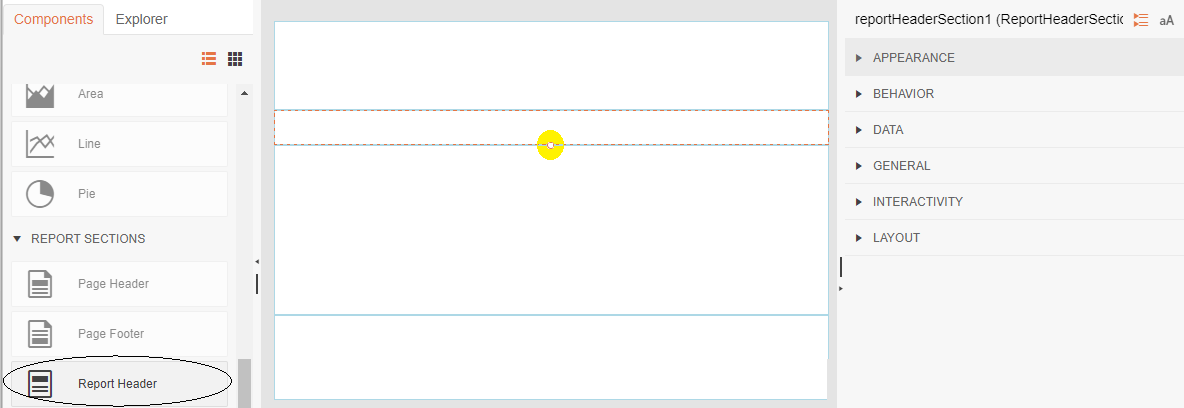
- Add your chart to a section of your report that, unlike the Details section is only displayed once—the Report Header section, for example. If you don’t have a Report Header in your report yet then, in the Explorer tab on the left of the designer, click on the top line (your report name). Then switch to the Component tab that’s right beside the Explorer tab and scroll down to Report Sections. Double-click on the Report Headers section to add a Report Header to your report.
Hint: Adding your chart to the Report Header section lets you begin your report with a chart and follow it with repeated data in the Details section. However, the default size for a report header is probably going to be too small to hold your chart. So, when the Report Header section is added to your report, click in the circle in the center of the section’s bottom border and drag it down to increase the size of the Report Header.
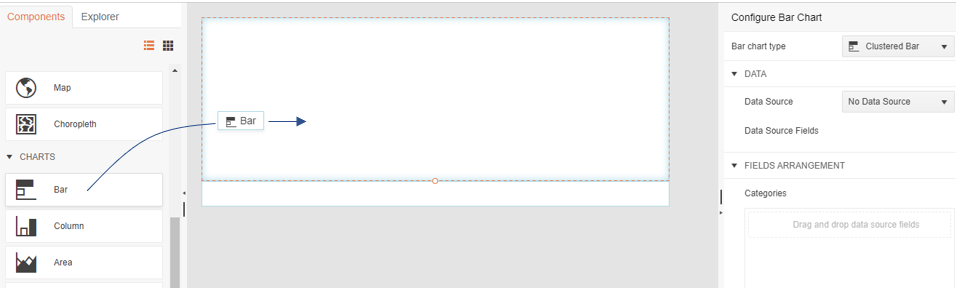
Your next step is to click on the chart you want in the Components tab (Charts are, conveniently, right above Report Sections in the Components tab) and drag your chart into your Report Header section. When you drop your chart, a convenient wizard will open in a panel on the right of the designer to help you configure your chart. It will effectively replace the Properties area helping you jumpstart the desired chart setup.
Hint: Before selecting a report in the Components tab, select the section of your report where you want to add the report. The Report Designer won’t even let you select a report unless your current selection is a section the designer can put a report into.
Your chart won’t be added to your report until you click the Create button at the bottom of the Wizard. So, if you decide you’ve picked the wrong chart or dropped it in the wrong section, you can just click the Cancel button at the bottom of the wizard, select the chart you want from the Components tab, drop it into the right section, and start over.
Configuring Your Chart
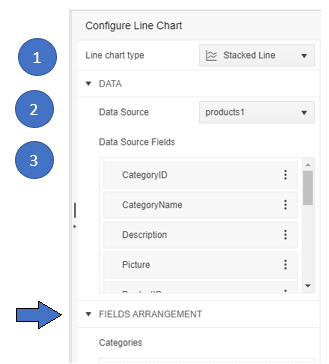
The wizard that appears to the right of the designer when you add your chart makes it easy to get the chart you want in just three steps:
At the top of the wizard there’s a dropdown list that lets you select from various versions of the chart type you selected (with a line chart, for example, you can select from a plain line, a stacked line, a line with markers, and more).
Under that dropdown list is another dropdown list that lets you select the data source with the data you want to chart.
Once you’ve selected a data source, the Data Source Fields area underneath the Data Source dropdown list will populate with the list of fields from your data source. Now, it’s just a matter of adding the fields you want to the three sections underneath the Fields Arrangement header to generate your chart.
The three areas under the Field Arrangements header are: Categories, Series, and Values. The Series area is where you’ll specify how you want your data labeled (i.e., the X-axis/bottom line in a column report).
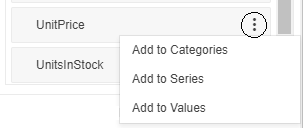
Hint: You can drag a field from the Data Source Fields into one of the Categories, Series, or Values areas if that works for you. Alternatively, you can click on the three vertical dots on each field and select the area you want to add the field to.
The Values area is where you specify what data you want charted: The scalar field in your data source that controls the points on a line chart or the length of the bars in a bar chart.
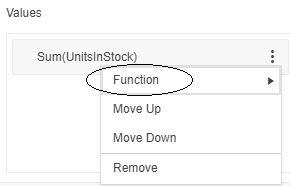
By default, when you add an item to the Values area, the designer assumes you want to sum all the data in a series. If you want to change how your data is aggregated (e.g., you want to see the average value rather than the sum), find your field in the Values area and click on the three vertical dots at the right end of the field’s box. That will display a menu with Function at the top. Click on Function to get another menu with a list of aggregation functions (e.g., the Average aggregate function).
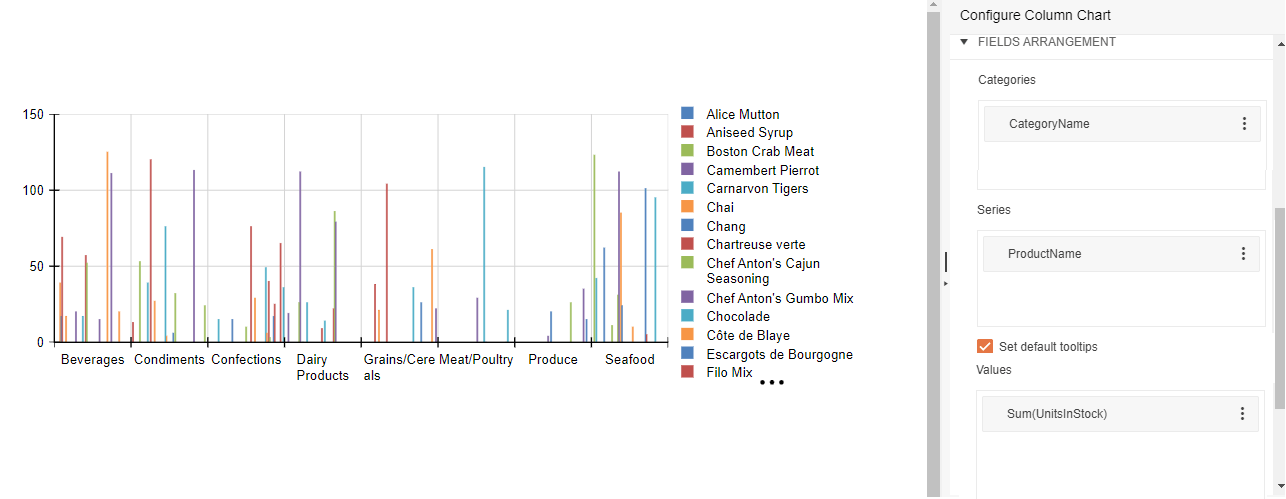
Using the Categories area is optional but will be useful where it makes sense to group the series to make your chart easier to read. This sample chart, for example, shows the Units in Stock for a large number of products which makes for a lot of entries along the X-axis. However, the chart also groups those products by the name of the category the product is part of—that should make it easier to find a product (well, provided you know what category the product is in).
Hint: Don’t panic if you add one of your data source fields to the wrong area. You can drag fields from any of the Categories, Series and Values areas into any of the other areas before you click the Create button.
Click the Create button and your chart is added to your report!
Next Steps
There’s lots more that you can do with your charts. You can, for example, take advantage of the Report Designer’s Filters to control what data drives the data in your chart. If you also take advantage of the designer’s Parameters, you can dynamically filter the data used in your charts while you’re viewing your report.
Since this chart/dashboard is for your use, appearance may not be a priority for you. However, if you do want to “dress up” your chart’s appearance, just select your chart in Report Designer to display the panel on the right. The settings in that panel let you control how your chart looks. For example, the No Data section in the panel will let you control the message displayed in the report when your data source doesn’t have any information available for your report.
Or you can expand the Appearance section of the panel on the right to reveal the Plot Area Style section. In that section, you can set the chart’s background color, background image, line style and more. Expanding the Presentation area, on the other hand, reveals the Legend, Series and Titles areas which let you control the appearance of those items.
There’s nothing stopping you from having exactly the chart (or dashboard) that you want in the application where you need it. You have all the tools to create your ideal report.
Ready to Take Advantage of Embedded Reporting?
Progress Telerik Reporting provides all the tools you need to embed the rich, interactive reports your users need in order to analyze and understand their data right into your users’ applications (including letting your users export the results into more than 15 formats, either to distribute or integrate with other analysis tools). Telerik Reporting then lets you go further and empower your users with a fully functional Web Report Designer to create the reports they want without ever leaving the applications where they’ll use their reports.
You can leverage these easy-to-use tools in both any client-side web application environment (HTML5/JS, Angular, React, Vue or Blazor) and any .NET application (web or desktop: ASP.NET Core, ASP.NET MVC, ASP.NET AJAX, WinForms and UWP).
If you still have not tried it, you can start a free trial to take a closer look. A renowned support service and an array of resources will help you along the way.

Peter Vogel
Peter Vogel is both the author of the Coding Azure series and the instructor for Coding Azure in the Classroom. Peter’s company provides full-stack development from UX design through object modeling to database design. Peter holds multiple certifications in Azure administration, architecture, development and security and is a Microsoft Certified Trainer.
Related Posts
Comments
All articles
Topics
Web MobileMobile
Desktop
Design
Productivity
People
