
Filtering Your Report’s Data at Design Time and Run Time with the Embedded Web Report Designer

Summarize with AI:
For a report to be genuinely useful, you don’t need all the data—you need the right data. In the Embedded Web Report Designer, here’s how to filter the first data displayed in a report and then how to filter the data while you’re viewing the report.
The Progress Telerik Web Report Designer lets you create the report you need. When the designer is also embedded in your application, you can create the report you need in the application where you need it (and the report will be waiting for you to view it when you come back to your application). This has to be the definition of the ideal report: The data you need, with the information you need, delivered where you need it.
After you’ve started creating a report and adding data to it, you’ll want to control what data is included in your report. With the Web Report Designer, you can control what data will appear in your report as part of creating the report.
But the reality is that you don’t always need the same data. In the real world, depending on what you’re doing with the application your report is embedded in, you may want to select the data to be displayed in your report while you’re viewing the report. The Web Report Designer lets you do that, too.
Selecting the Data to be Displayed
Either way, to control what data is displayed in your report, you need to add a filter:
In the panel on the left of the designer, switch to the Explorer tab and select the top line (it will be the name of your report).
Now switch to the panel on the right of the designer and expand the Data section to reveal the Filters property.
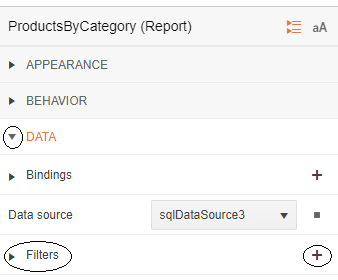
- Click the plus sign to the right of the Filters property to display the Add New Item dialog.
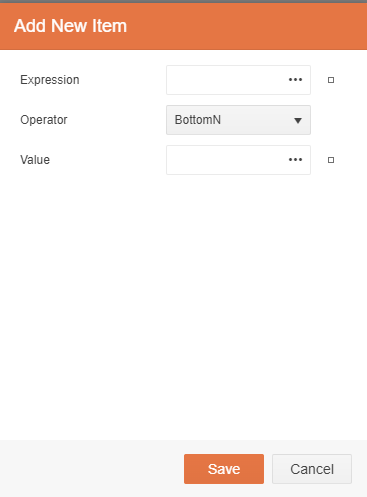
Click on the three dots to the right of the Expression textbox to display the Edit Expression dialog.
In the Edit Expression dialog, in the list on the lower left, click on the Fields item to display a list of fields that you can use to control what data will be displayed in your report. Double-click on the field you want to use to filter your data (in the example, the data will be filtered by UnitPrice).
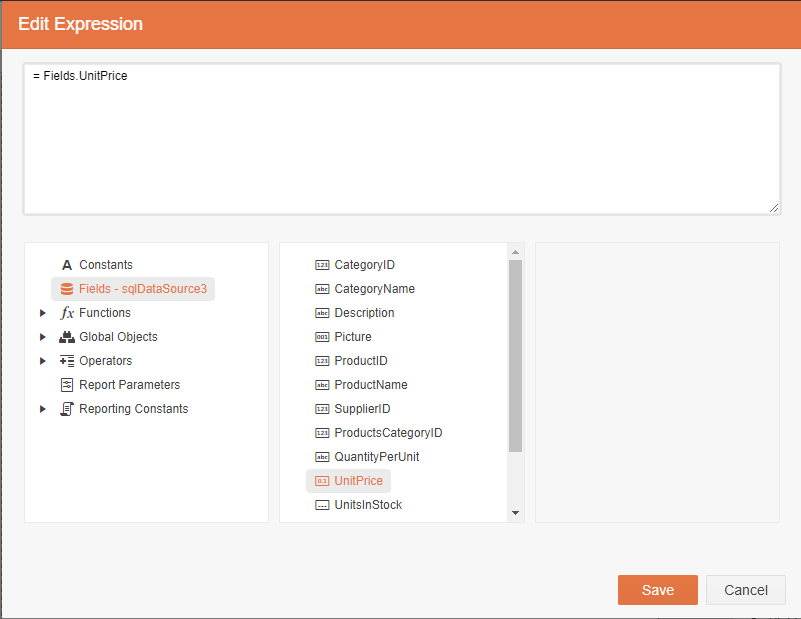
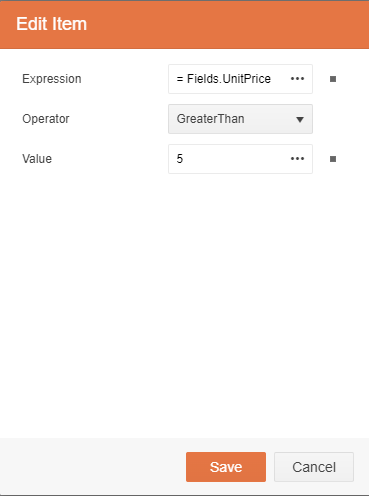
Click the Save button to return to the Add New Item dialog. The Expression textbox will be filled in with the selection you made in the Edit Expression dialog.
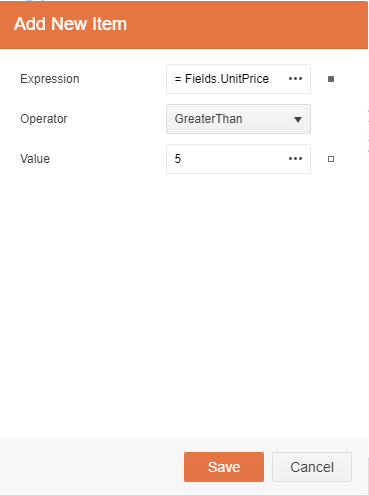
Select an operator from the Operator dropdown list (this example uses GreaterThan).
In the Value textbox, set the value that will control what data is displayed. If you want to compare against another field, you can use the three dots to the right of the Value textbox get a list of fields you can use (this example is simpler: it just limits the report to Products with a UnitPrice greater than $5.00).
Click the Save button to return to your report. Now, when you display your report only the rows that your filter allows will be displayed.
Interactively Selecting the Data to be Displayed
If you want to interactively control what data is displayed while you view your report, then you can add a report parameter to your report and use that report parameter in your filter. When you’re viewing your report, you’ll be able to interactively change the value of that report parameter to control what data is displayed.
Hint: You can create your filter and parameter in any order that makes sense to you. However, creating the filter first does let you check that the right data is being displayed for whatever value you set in the filter. Then, once you know your filter is working the way you want, you can convert the filter to use a report parameter.
To add a report parameter:
Switch to the Explorer tab in the panel on the left of the designer and, at the top of the panel, select the top line in Explorer (the name of your report).
Now switch to the panel on the right of the designer and expand the Data section to reveal the Report Parameters property.
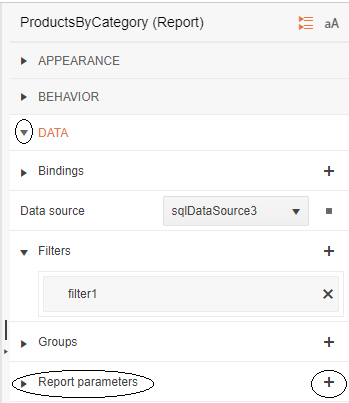
- Click the plus sign to the right of the Report Parameters property to display the Add New Item dialog.
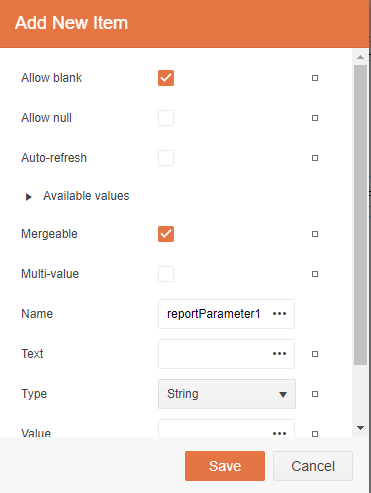
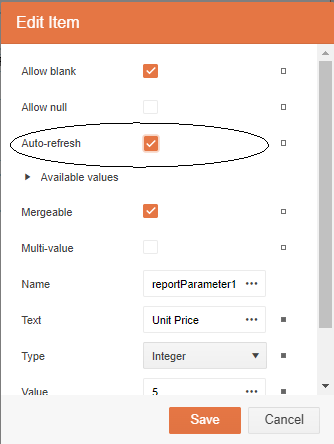
In the Add New Item dialog, set the Text property to some label that will identify your parameter when your report is displayed.
Below the Text property, in the Type dropdown list, select the kind of data that you’ll be entering when filtering your data (for UnitPrice, for example, you could select Integer because UnitPrice is a number).
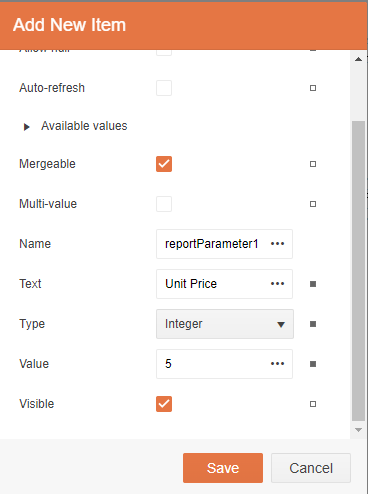
Next, in the Value field, set an initial value to use to control which data is displayed when the report is first opened.
Finally, at the bottom of the dialog, select the Visible checkbox so that your Report Parameter will be displayed when your report is opened—that will let you change the Report Parameter’s value.
This example sets the Text to “Unit Price greater than” to flag that this report parameter will be used with the UnitPrice filter described earlier. Because UnitPrice is a numeric field, the Type dropdown list is set to Integer. The Value property is set to 5 so that, initially, only the Products whose UnitPrice is greater than $5.00 when the report is displayed.
Click the Save button to return to your report.
With your Report Parameter created, you can use it in a filter to control what data is displayed when your report is opened. In this example, that means modifying the filter that was created earlier that filtered data based on the UnitPrice field.
The next step is to modify a filter to use the report parameter:
Again, select the top line in the Explorer tab in the panel on the left.
In the panel on the right, expand the Data section to reveal the Filters property.
Expand the Filters property to find the filters you’ve created.
Double-click on the filter where you want to use your parameter—the Edit Item dialog will display.
In the Value textbox, click on the three dots to the right to open the Edit Expression dialog.
Erase whatever is currently in the textbox at the top of the dialog
In the box in the lower right, click on the Report Parameters list to find the Report Parameter you created. Each parameter will have a Value and a Label entry displayed in the list in the middle (you’re going to want to use the Value entry).
Double-click on the report parameter’s Value entry to make your parameter the new value used in your filter.
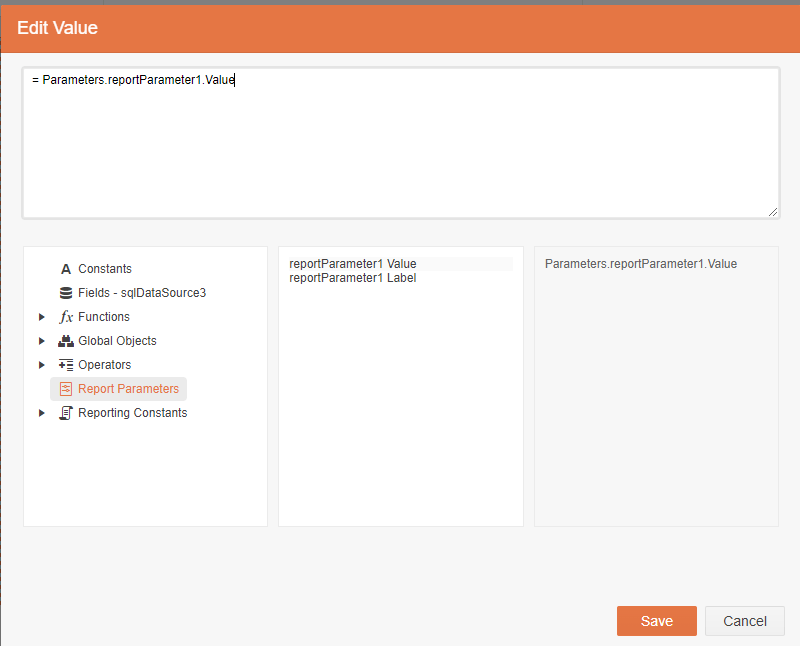
Click the Save buttons to return to your report.
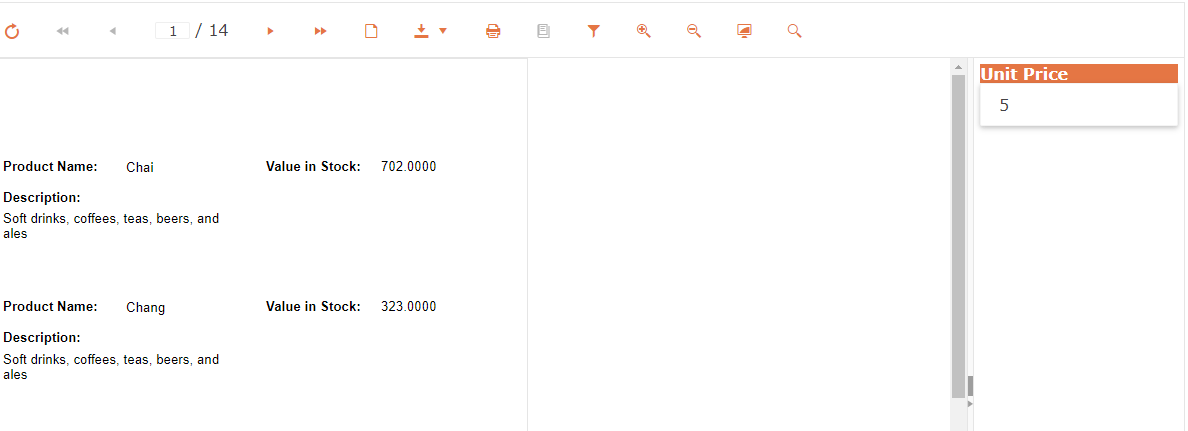
Now, when you click the Preview button your report will have a new panel on the right showing your Report Parameter with its initial value. When you change the value in the parameter and click on the report’s Preview button, the report will update to show only the data that meet the combination of your filter and the value you’ve set in your Report Parameter.
Hint: Really, having to click the Preview button after you change a parameter in the report’s filter pane is an unnecessary extra step. Fortunately, you can eliminate the Preview button in the filter panel altogether: When defining your Report Parameter just check the Auto-refresh checkbox in the parameter’s Edit Item dialog. Now, after you change the value in the report’s filter panel, you can just hit the Tab key to have your report redisplay showing the filtered data.
Next Steps
You can, of course, have as many filters and report parameters as you want in a report. You can also create the report parameters and the filters in whatever order makes sense to you.
You can also make it easier to set values in your parameter. For example, it’s worth looking at the Available Values property in the Add New Items dialog when creating your parameter. Available Values will let you set up a dropdown list of acceptable values to pick from when setting your report parameter’s value.
But, no matter what you do with your filters, you’ve now got a report that gives you the data that matters to you in the application where you need it—you can even select the data as you’re viewing the report. This is the definition of the ideal report.
Ready to Take Advantage of Embedded Reporting?
Progress Telerik Reporting provides all the tools you need to embed the rich, interactive reports your users need in order to analyze and understand their data right into your users’ applications (including letting your users export the results into more than 15 formats, either to distribute or integrate with other analysis tools). Telerik Reporting then lets you go further and empower your users with a fully functional Web Report Designer to create the reports they want without ever leaving the applications where they’ll use their reports.
You can leverage these easy-to-use tools in both any client-side web application environment (HTML5/JS, Angular, React, Vue or Blazor) and any .NET application (web or desktop: ASP.NET Core, ASP.NET MVC, ASP.NET AJAX, WinForms and UWP).
If you still have not tried it, you can start a free trial to take a closer look. A renowned support service and an array of resources will help you along the way.
Next up: Adding Group Headers and Subtotals with the Embedded Web Report Designer

Peter Vogel
Peter Vogel is both the author of the Coding Azure series and the instructor for Coding Azure in the Classroom. Peter’s company provides full-stack development from UX design through object modeling to database design. Peter holds multiple certifications in Azure administration, architecture, development and security and is a Microsoft Certified Trainer.
Related Posts
Comments
All articles
Topics
Web MobileMobile
Desktop
Design
Productivity
People
