
Choose a Theme
Use one of four professional themes:
- Use out-of-the-box
- Customize to meet brand guidelines.

Telerik DevCraft
Redefine productivity with the ultimate UI component toolkit for every platform and technology, featuring MCP servers, reporting, document processing, and mocking tools.
DevCraft bundles include UI libraries & tools
30-day FREE trial. Free technical support during your trial. No credit card required.
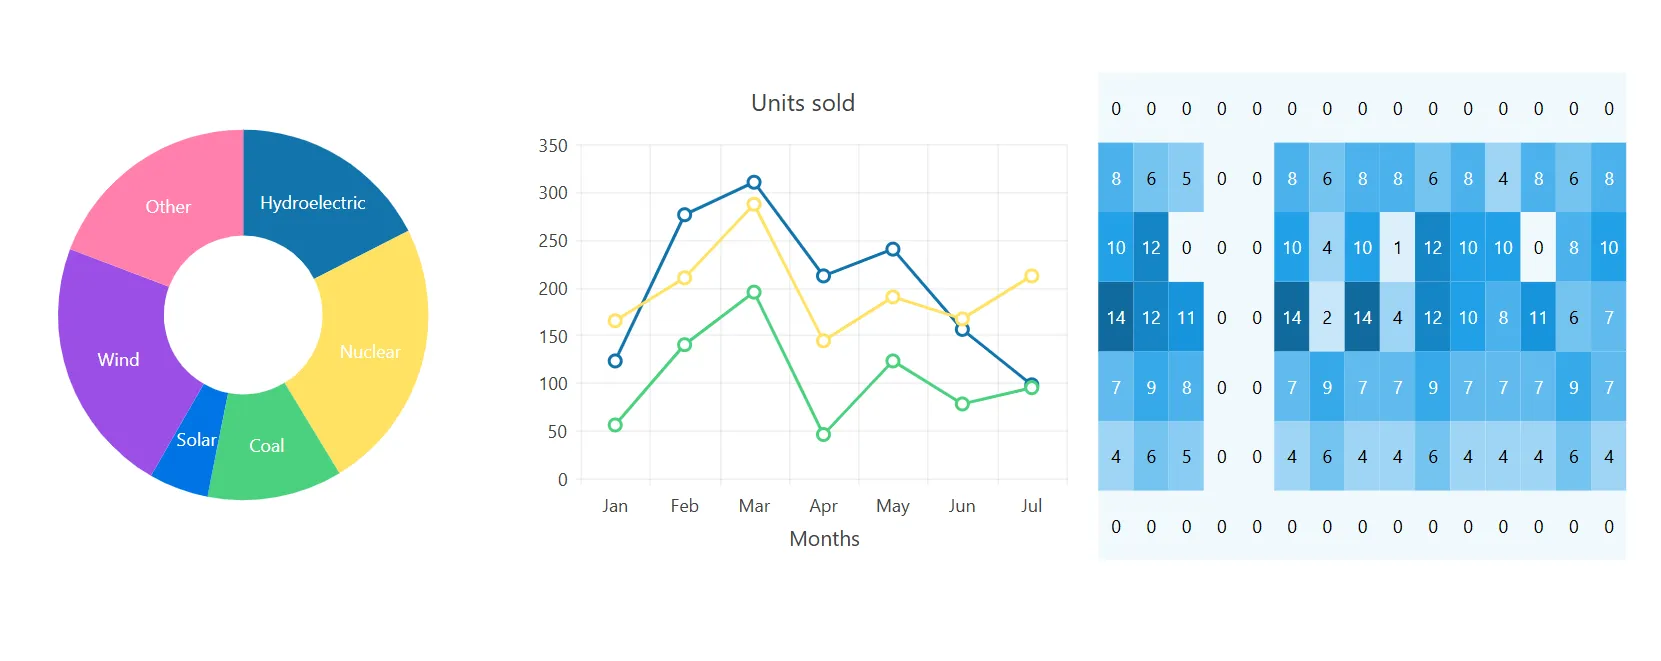
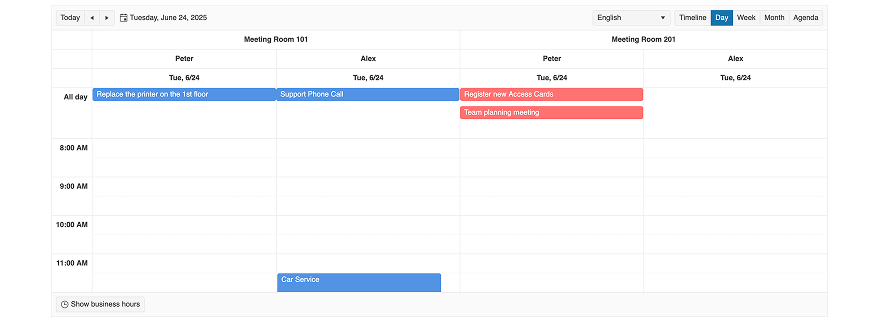
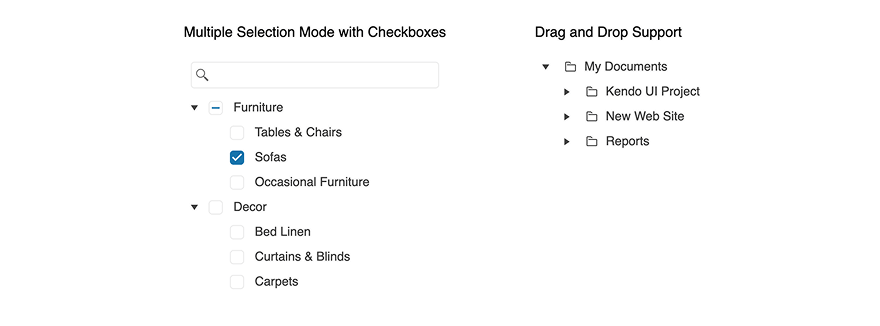
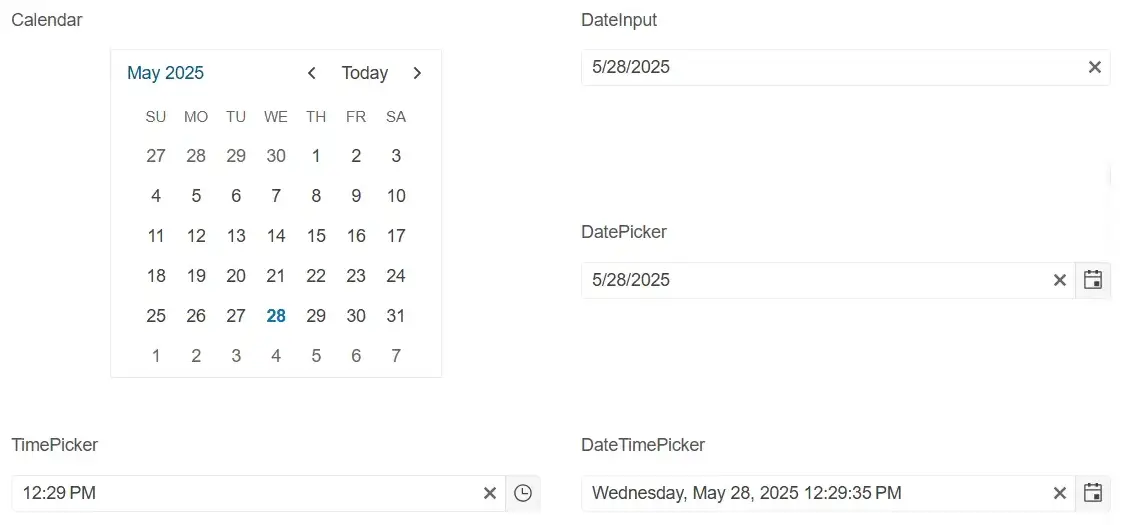
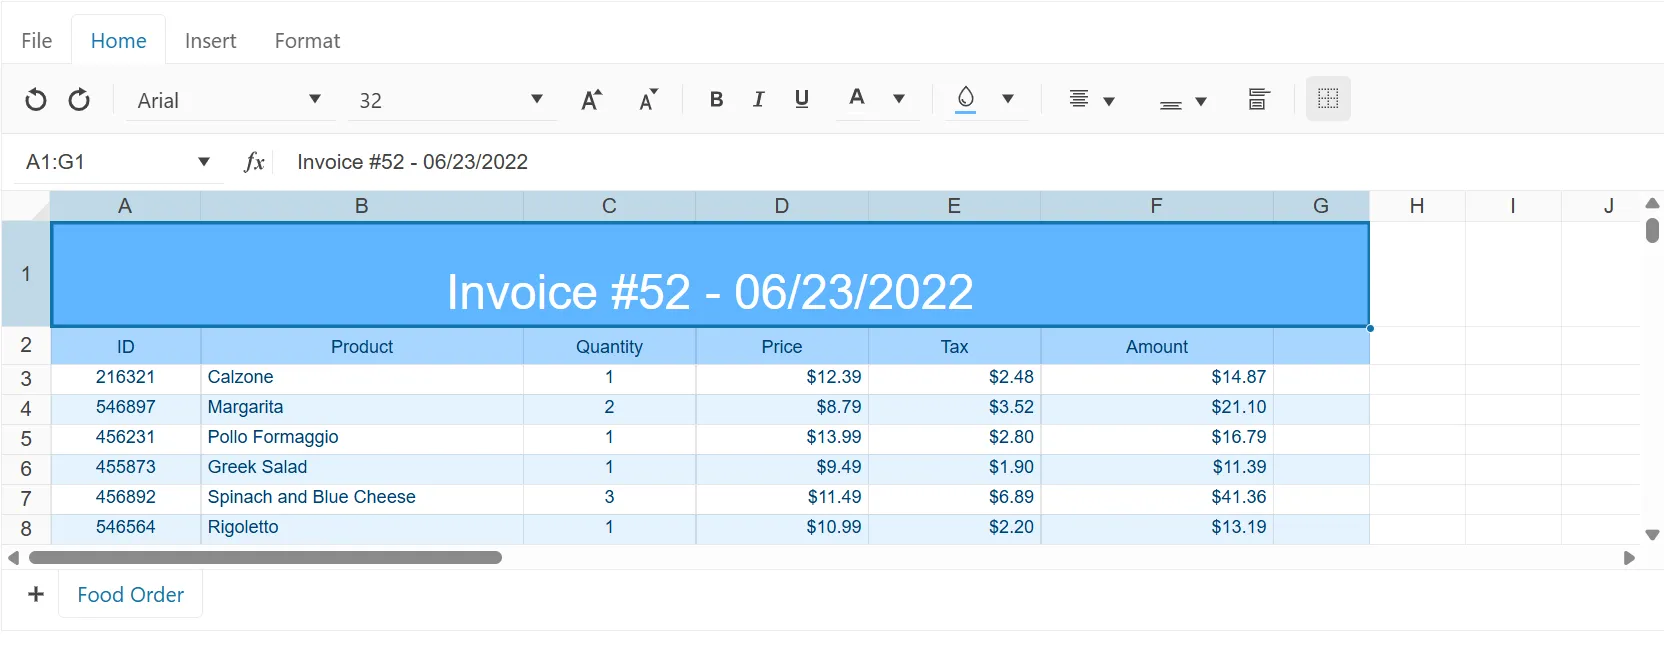
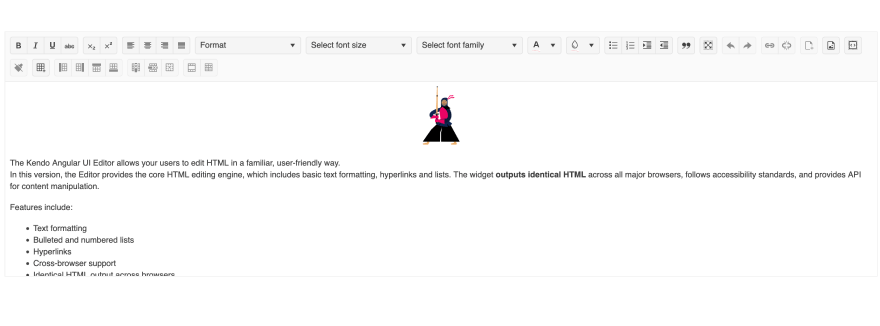
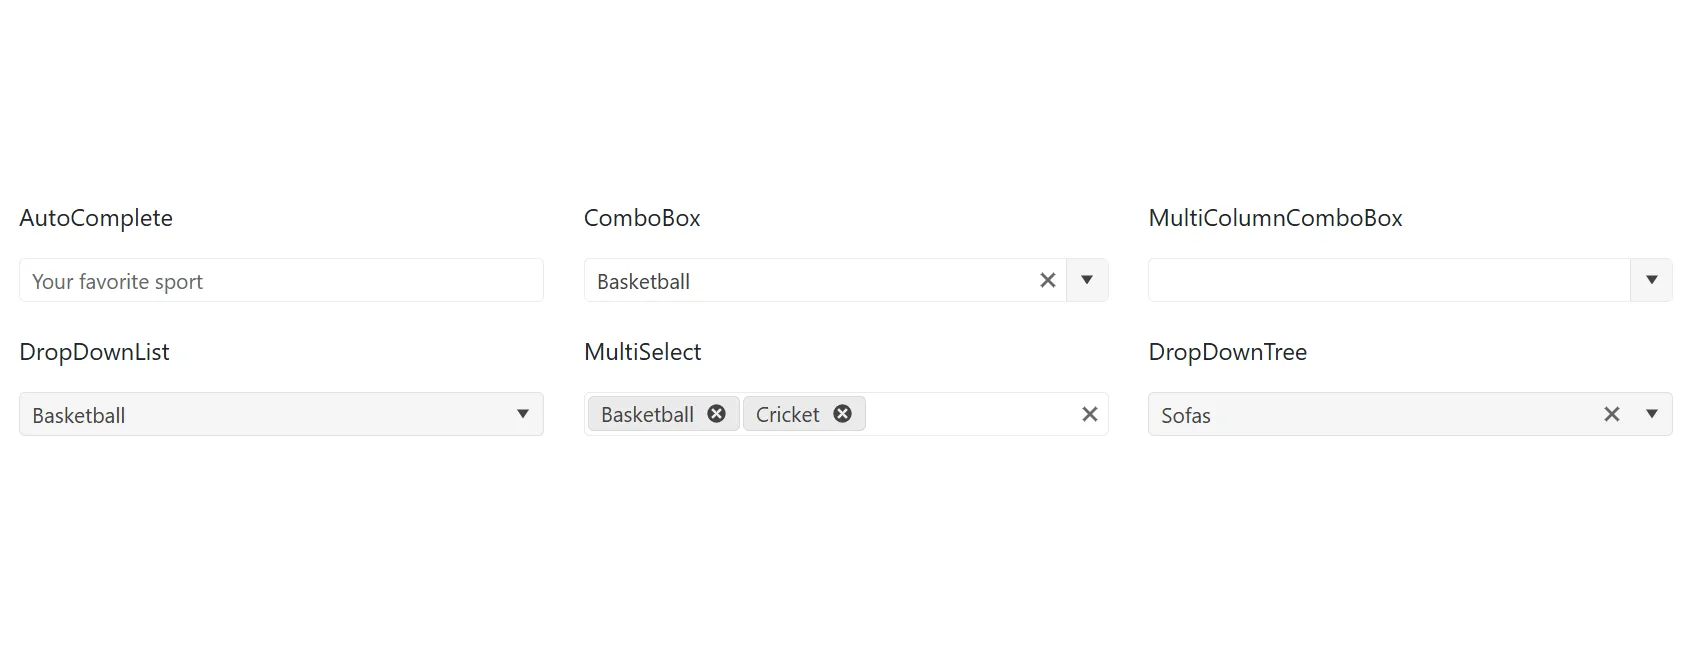
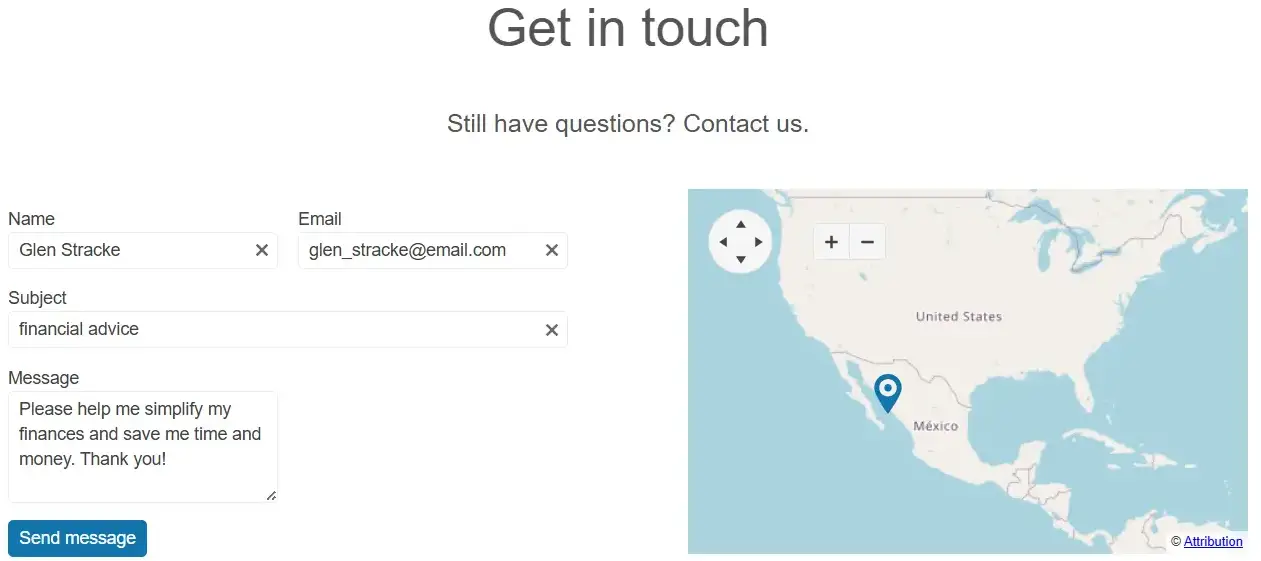
Build feature-rich, modern experiences for web, cross-platform, mobile and desktop with AI-powered
Telerik and Kendo UI components.
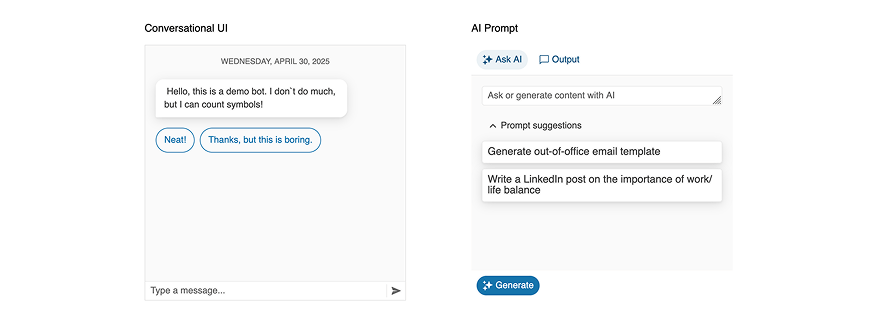
MCP Servers for Developer Productivity
AI tools that bring Telerik and Kendo UI context to your LLMs for better outputs.
AI-Ready Components
A single place to find all AI-ready UI components and Smart features across Telerik and Kendo UI.
AI-powered, lightweight, cross-platform reporting solution for building, embedding and exporting rich, interactive reports in .NET applications.
DemosEnd-to-end report management solution to store, manage and view reports efficiently.
DemosAI-enhanced set of libraries for manipulating the most used document formats for web, desktop and .NET applications.
DemosThe fastest, most flexible and complete mocking tool for crafting unit tests.
Documentation


Whether you have a designer on your project or not, Telerik DevCraft brings the tools you need to simplify the process and improve the quality of your app's UI and UX.
Use one of four professional themes:

Quickly spin off common page types using building blocks and page templates.

Use ThemeBuilder to style your app without dealing with complex CSS rules.

Get all your styling questions answered with the detailed design and front-end documentation.

Give the Figma UI kits to your designers and start speaking the same language.

Import the Figma design into ThemeBuilder to generate the CSS.

Map the Figma variables to your UI components in ThemeBuilder and automatically sync design updates.
Get all your styling questions answered with the detailed design and front-end documentation.
30-day FREE trial including technical support and training.
No credit card required.
per developer,
per year
per developer,
per year
per developer,
per year
Greatness—it’s one thing to say you have it, but it means more when others recognize it. Telerik is proud to hold the following industry awards.

Uncompromised quality comes from a 15-year track record of helping millions of developers create beautiful user experiences for mission-critical applications.
Read the story

30-day FREE trial. Free technical support during your trial. No credit card required.


