Reporting vs. Control Suites—How to Make the Right Choice?

Reporting solutions and control suites are both powerful options for presenting data. We analyze how you can choose which is best for you.
We are living in a world where technologies develop so rapidly that it is difficult to stay ahead of them. New tools are entering the market every day and sometimes we can hardly decide how to differentiate and apply them properly to our projects. With this article, we try to help you decide between when to use a reporting solution and when to build custom views with a control suite in your application.
We will go through some main use cases and recommend the best fit for each. In addition, we will deep-dive into the most beneficial scenarios for a reporting solution. Of course, from а reporting point of view, we will also examine the features of Progress Telerik Reporting.
Reporting Solutions vs. Control Suites
Reporting solutions are created with the purpose of quickly making data visualizations from various data sources purposed for previewing, printing, sharing and archiving. On the other hand, control suites are built with customizability, live updates, and interactivity in mind. In recent years, reporting solutions have started to advance more actively in the interactivity area as well.
Firstly, let's review the common use cases, where both perform equally well:
Use Cases Where Both Perform Well
- Data mashing (or the ability to display data from multiple data sources)
- Conditional formatting as a possible styling option (or the ability to change the appearance of data based on pre-defined conditions)
- Displaying hierarchical data, as well displaying data analysis and graphs
- Crosstab/pivot data tables and presentations
Then come the differences—let's talk about where each type excels:
Control Suites Advantages
- Data input (CRUD—create, read, update and delete)
- Fast browsing of large data sets (paging virtualization)
- Rich customization in theming
- Animation options
- Live data/dashboards
Reporting Suites Advantages
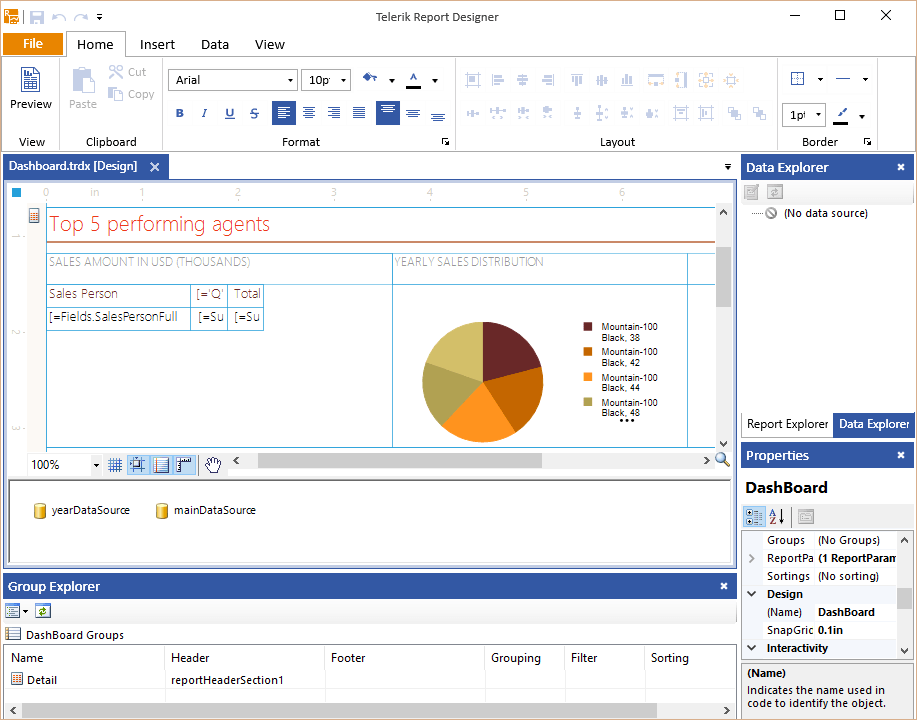
- Easier to layout and achieve the desired look with WYSIWYG business user-friendly designer
- Variety of styling possibilities—CSS-like styling, conditional formatting based on complex formulas
- Reporting deals with full data sets (filtering, sorting, parameters)
- Simple to setup interactivity—Interactive Sorting, Toggle Visibility, Table of Contents and Document Map, Navigate to Report, Navigate to Bookmark, Navigate to URL, plus whatever you need with custom actions
- Designed for printing media and designated page settings in its core
- Comprehensive selection of export formats for sharing and archiving
- Designed for report definition reuse—cross-platform, cross-technology (web, mobile, and desktop) offering the same report outlook
Now, let us review some scenarios of Reporting vs. UI controls implementations:
Common Reporting Scenarios
- If you can't spare skilled developers to design and implement reports, you can use professionals with basic data operations and/or business understanding and utilize an easy to learn WYSIWYG Standalone Report Designer

- If animated data visualizations are required, you will need a control suite that supports various animations
- If you have to embed the same data preview in a web and desktop application, then with a reporting solution you can reuse the same report definitions (views) and utilize the dedicated report preview controls/widgets
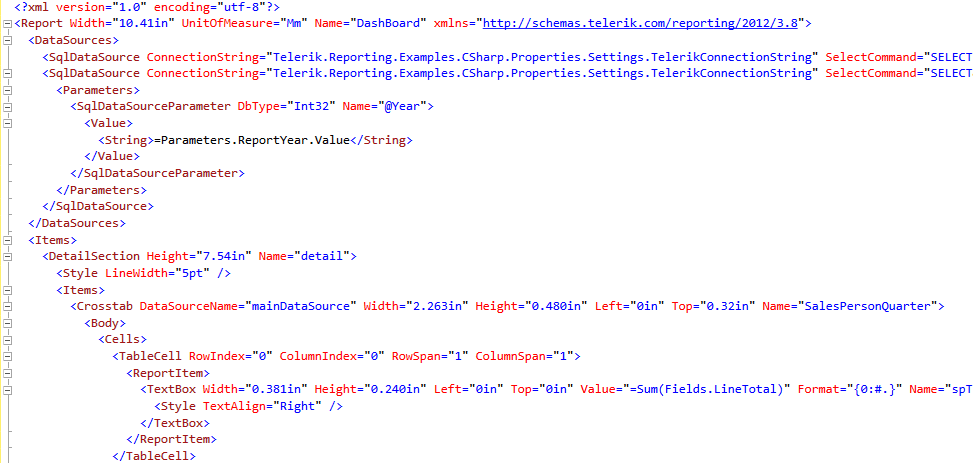
- If you need to avoid the recompilation of the application every time a new report definition is needed or simple change is required, you should use a reporting solution that works with XML report definition, so you can publish new/updated report definitions without even restarting the application
- If you have a requirement to allow end users to alter/author data presentations, you should use the Standalone Report Designer which does not require additional licensing and you can provide it for free
Finally, let’s deep-dive into Reporting with some tips and tricks for better data visualization and report usage:
Diving Deeper into Reporting
- Utilize the power of report data binding combined with simple grouping/sorting/filtering expressions. The reporting handles all data scopes generation and the corresponding data presentation repetition for you, making it much easier to produce analytical, master-detail, form reports or whatever your requirement is.

- Use stylesheets whenever possible. Later the same styles can be used in the next report, or if a styling change is required you will avoid altering every single report and only apply it to the stylesheet.
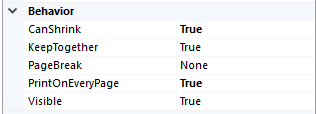
- Play with the advanced paging rules that a reporting solution provides for the report items like keep-together on the same page, stick with other bands, repeat bands on each page, print at bottom. This allows great control for reports designed with printing purpose.

- Consider using the Standalone Report Designer, which is application dedicated to designing reports and works with XML report definitions. This way you will not have to recompile your application for any small change made to a report definition. The designer does not require any additional licensing fees. What Telerik Reporting adds on top is a self-containing report format called TRDP (Telerik Reporting Definition Package), which contains the XML report definition plus all necessary resources like images and CSV data in it, zip packaged, making it perfect for sharing through email or storing for review.

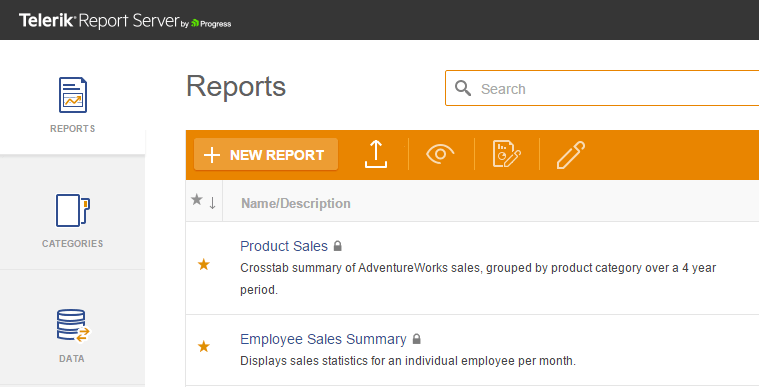
- Evaluate the Progress Telerik Report Server, if you need a dedicated ready-to-use solution to store, manage, schedule and deliver reports. The Report Server in its core uses the Telerik Reporting engine, thus you get all of the reporting engine goodies with all of the report server solution benefits out of the box.
Consider Your Needs to Decide What Fits
Both Reporting and UI control suites are compelling data presentment solutions, each powerful in its own way. Very often developers choose to combine them and utilize their benefits to the greatest extent.
Another thing to keep in mind when you are choosing between a control suite or reporting solution for a feature is the development approach. By using a control suite, you are expected to write code to implement the desired look and behavior. By using a reporting solution, development could be easier and more visual. With Reporting, for most of the reports you will not have to write any code. Telerik Reporting also gives business users the ability to create new reports or edit the existing ones as they desire using the Standalone Report Designer. Using a control suite also typically targets only one technology, be it Windows Forms, WPF, or ASP.NET. By utilizing a reporting solution, you can implement the reports once, and use them in all those technologies.
Leverage on a specific use case, and decide what fits it best—a reporting solution or control suite. Both have one very common advantage—they are specially created to fulfill any developer's need. So, enjoy them to the maximum!
If you're curious to learn more about Reporting or want to start a free trial and see if it works for you, just click here.

Milen Elkin
Milen Elkin is Product Manager of Telerik Reporting & Telerik Report Server. It’s been a while since he joined the company back in 2007. What drives his work is the belief that handling data should be easy. Besides his work, he likes running and cycling in the city of Sofia and enjoys the countless shapes and shades of green color up in the Bulgarian mountains.

