What’s new in RadHtmlChart in the Q1 2013 Release of RadControls for ASP.NET AJAX
We released RadHtmlChart in Q2 2012 and ever since we have been gathering your feedback on what other features you want to see in the control. It has been less than a year since its initial release and we have nearly doubled the feature set. Check out the original comparison with RadChart, the first big features delivery, take a look at the Release notes and read on to see what we added in Q1 2013.
You can see we have gone a long way, so in this list I will try to order the features by their popularity, so stick with me till the end of this post.
Conditional item colorization
Usually a series must be easily identifiable through its colour, so a simple property that sets it should suffice. This is what we thought initially. It turned out that in many cases a certain item from a Bar series would need to be red, for example, while the rest of the series is green. This worked out of the box for Pie charts, but that’s the point of pie charts – each item having custom color, name, value, which are usually attributes for the entire series in all other chart types. 
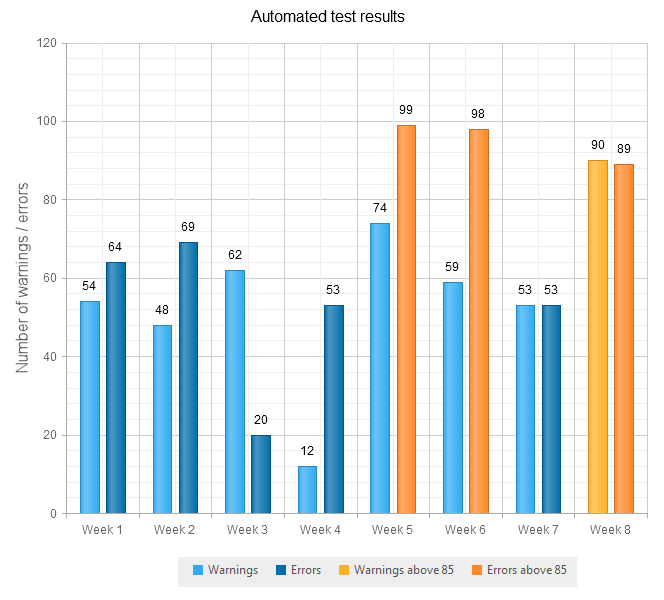
What we did was to have the ColorField property work for all series types the chart has now. Just add a column to your datatable or a field in your custom object that will specify the color for each item and you are set. See it live in the Conditional Item Colorization demo and read on about its effects in the online documentation.
More options for controlling the appearance of the text
So far – you could set the color for every element of the chart, but it turned out this was not enough for everyone, so we added margin, padding and font properties for the labels of the series because this was the most common request at the time. It looks like the trend caught on so we extended this to all labels and titles – now the axis labels can be bold and italic and use Comic Sans, for example. See the full details here.
Bubble and Donut charts
If you have requested these types you already know what they are, but for the rest – here is a brief description:
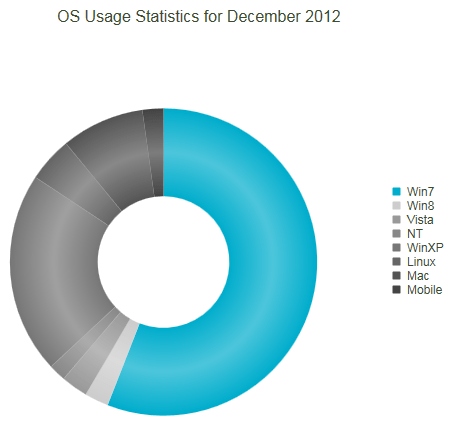
Donut charts are essentially a pie chart with a hole in the middle. Just some visual flair, but it looks quite nicely
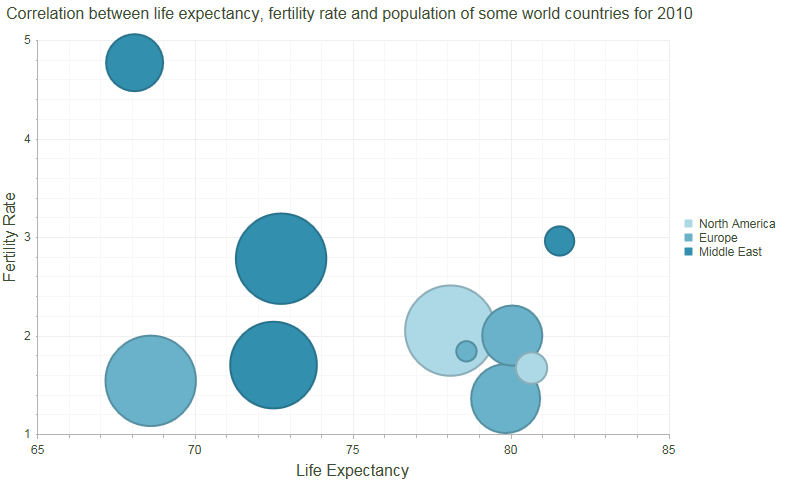
Bubble charts are quite more complex, however. They are similar to Scatter charts but have a third dimension – the size of the bubble. You can think of them as a more scientific type. Take a physics experiment that accumulates values with each test and when they match – the bubble size should be increased to indicate the more common case. Or use it for statistics if you don’t like physics. But I do :-)
Check them out in their respective demos – Bubble chart and Donut chart.
The single DataItem is available in the client-side events
Take a pie series. Look at it, examine the data. Do you sometimes click aimlessly around the page you are looking at while thinking? I know I do. Now the chart can react quite nicely to that. You can have it toggle whether the item the user clicks is exploded. Not only does this add even more interactivity to the chart, but it can also make it easier to understand, especially if there are many items cramped together. Take a look at the details about the event and scroll down to the first code snippet for a simple example.
The DataSource of the chart is available on the client
RadHtmlChart is quite interactive and renders through JavaScript, yet the possibilities this offers were not explored too much. Naturally, we reached this point – you can now modify the chart’s DataSource on the client as well. Only with a few lines of JavaScript you can change all the data that is shown, without as much as an AJAX request.
You can get the JSON string and use a single jQuery method to turn it into an array that is easy to manipulate. You can call a WebService that will get you the new data and pass that to the chart. The formats it can take are quite intuitive - a JSON string or an array.
Read through the Client-side API of the control for details and stay tuned, because an online demo is coming soon that will be as close to a real life scenario as an example can be.
Is there more
If you have read through this entire list you know that we have been very busy. But this is not all; we already have some ideas for more features, so we are not backing down.
Your opinion matters, so share your thoughts in a comment here, send us a ticket or search in our Feedback portal to see what is already logged and vote.

Marin Bratanov
Marin Bratanov was a Principal Technical Support Engineer in the Blazor division.


