
Measuring Performance with the JavaScript Performance API

Summarize with AI:
Accurate performance measurements are an important part of app maintenance, especially as our apps scale up. We’ll look at two of the functions provided in the JavaScript Performance API for just this purpose.
As web applications continue to grow in complexity and scope, performance and the capability to measure and analyze it accurately becomes increasingly important. In this article, we’ll investigate the JavaScript Performance API, a helpful tool designed to provide us with a set of standards we can use to measure the performance of web applications.
The Performance API
The JavaScript Performance API is part of the Web Performance API suite, a suite of tools that offer developers a unified approach to evaluate various performance aspects of their web applications. This includes detailed insights into page loading times, resource loading events, network requests and the execution times of scripts.
The API is accessed through the performance object available in the global execution context of JavaScript. This object is the gateway to all performance-related metrics.
const perfData = window.performance;
The performance object contains many methods and properties designed to assist in gathering precise performance data. In this article, we’ll focus our attention on two particularly useful functions: performance.mark() and performance.measure().
performance.mark
The performance.mark() method is a core function of the Performance API, as it enables us to create a timestamp in the browser’s performance entry buffer. In simpler terms, it helps mark a specific point in time during the page’s execution. This method is used for creating named marks that can later be referenced by the performance.measure() method (which we’ll see shortly).
As an example, let’s consider a scenario where we have a React component in our web application that makes an API request to https://jsonplaceholder.typicode.com/todos when a button is clicked, and we want to measure the time it takes for the list of data retrieved from the API to populate our page.
import React, { useState } from "react";

export function App() {
  const [todos, setTodos] = useState([]);
  const [isLoading, setIsLoading] = useState(false);

  const fetchTodos = () => {
    setIsLoading(true);
    fetch("https://jsonplaceholder.typicode.com/todos")
      .then((response) => response.json())
      .then((data) => {
        setTodos(data);
        setIsLoading(false);
      });
  };

  return (
    <div>
      <button onClick={fetchTodos}>Fetch Todos</button>
      {isLoading ? (
        <p>Loading...</p>
      ) : (
        <ul>
          {todos.map((todo) => (
            <li key={todo.id}>{todo.title}</li>
          ))}
        </ul>
      )}
    </div>
  );
}
In the code example above, the component maintains two pieces of state: todos, which stores the list of todo items, and isLoading, which indicates whether the data is currently being fetched. When the user clicks the “Fetch Todos” button, a loading message is shown in the UI before a list of todos is displayed.
Our goal is to measure the performance of functionality we’ve created by measuring the amount of time it takes for the API request to complete and for the fetched data to be rendered on the page. To help us achieve this, we’ll utilize the performance.mark() method to track two specific moments in the execution of our code—when the fetch request starts and when the request completes and the data is rendered.
To get started, we’ll place a performance.mark() call at the beginning of the fetchTodos function to mark the start of the fetch operation.
import React, { useState } from "react";

export function App() {
  // ...

  const fetchTodos = () => {
    // Marking the start of the fetch
    performance.mark("startFetchTodos");

    setIsLoading(true);
    fetch("https://jsonplaceholder.typicode.com/todos")
      // ...rest of the fetch code...
  };

  return (
    // ... the component markup...
  );
}
Adding performance.mark("startFetchTodos") just before the fetch request is initiated helps create a timestamp named “startFetchTodos” in the performance entry buffer.
Next, we’ll place a second performance.mark() call after the fetched data is set in the state, and the component finishes rendering the data. To achieve this, we could place the mark right after the setTodos(data) call. However, to accurately measure the time it takes for the browser to render the updated state, we’ll want to place the performance mark after the retrieved data is painted on the browser. Remember, React’s state updates may not correspond immediately with DOM updates!
To ensure that we mark the moment after the data is literally rendered on the page, we’ll use the window requestAnimationFrame method. This method tells the browser that we wish to perform an animation and requests that the browser call a specified function to update an animation before the next repaint.
In other words, requestAnimationFrame ensures that the performance mark is added at the precise moment after the browser completes its painting process, capturing the actual time taken for the user to see the updated content on their screen.
import React, { useState } from "react";

export function App() {
  // ...

  const fetchTodos = () => {
    performance.mark("startFetchTodos");
    setIsLoading(true);

    fetch("https://jsonplaceholder.typicode.com/todos")
      .then((response) => response.json())
      .then((data) => {
        setTodos(data);
        setIsLoading(false);
        requestAnimationFrame(() => {
          // Marking after the data is rendered
          performance.mark("endFetchTodos");
        });
      });
  };

  return (
    // ... the component markup...
  );
}
With these two performance marks, startFetchTodos and endFetchTodos, we now have precise reference points marking the start and end of our fetch operation. This setup allows us to accurately measure the total time taken for the API request and for the fetched data to be rendered on the page.
performance.measure
The performance.measure() method is another key function of the Performance API, used for calculating the duration between two performance marks. It creates a named measurement between two specified points, allowing us to understand how long a particular process takes in an application.
In our todos list example, we’ll use performance.measure() to calculate the duration between the startFetchTodos and endFetchTodos marks. This will give us the total time taken for the API request to complete and the fetched data to be rendered on the page. We’ll place the performance measurement at the end of our fetch request alongside a console.log message to log the time taken for the entire process (in milliseconds).
import React, { useState } from "react";

export function App() {
  // ...

  const fetchTodos = () => {
    performance.mark("startFetchTodos");
    setIsLoading(true);

    fetch("https://jsonplaceholder.typicode.com/todos")
      .then((response) => response.json())
      .then((data) => {
        setTodos(data);
        setIsLoading(false);
        requestAnimationFrame(() => {
          performance.mark("endFetchTodos");

          // creating performance measurement
          const measure = performance.measure(
            "fetchAndRender",
            "startFetchTodos",
            "endFetchTodos"
          );
          console.log(`Total time for fetch and render: ${measure.duration}ms`);
        });
      });
  };

  return (
    // ... the component markup...
  );
}
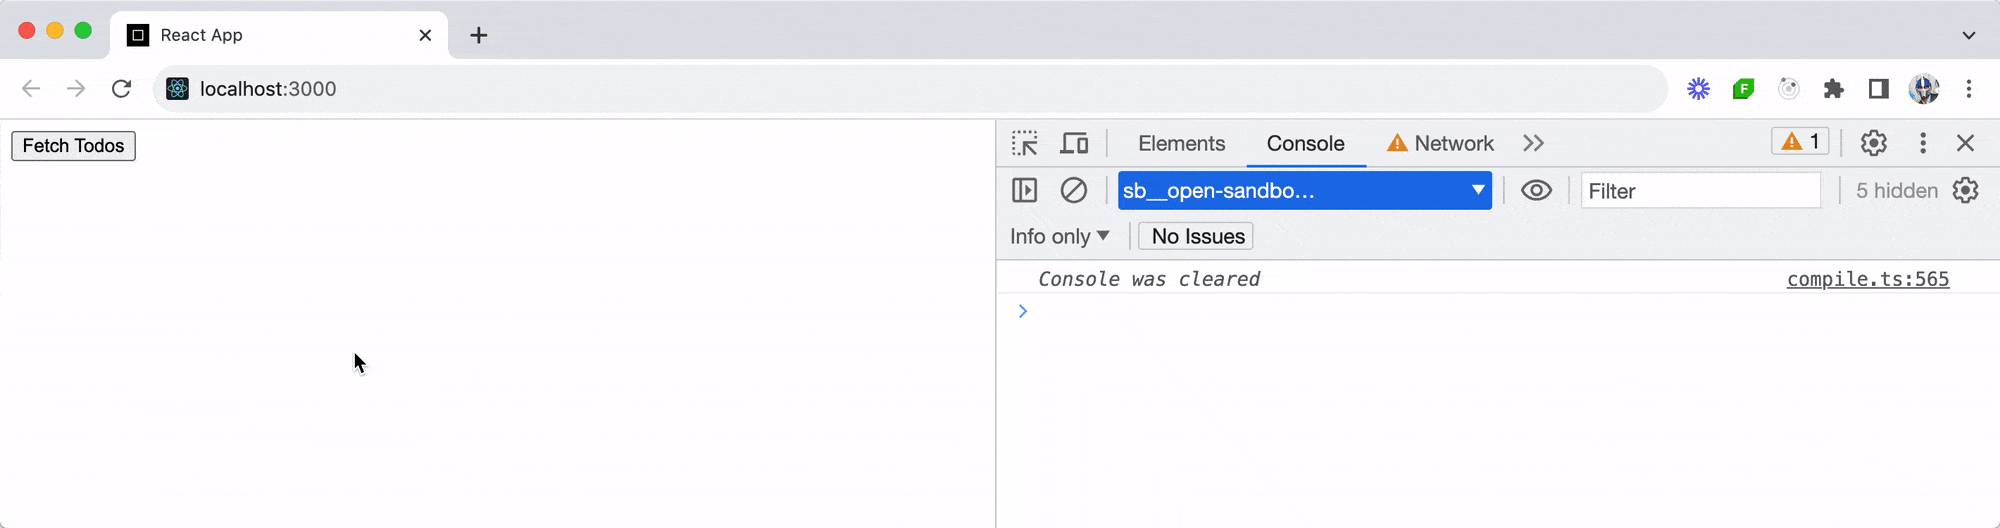
When visiting the browser and clicking the “Fetch Todos” button, we’ll notice a console log displaying the total time taken for the entire process of fetching and rendering the data!
If we were on a slower connection, we would notice a larger value in our performance measurement console log, reflecting the additional time required for fetching and rendering the data due to the reduced network speed.
See the above running code example in this CodeSandbox link.
Wrap-up
The JavaScript Performance API offers a robust framework for developers to accurately measure and optimize the performance of their web applications. While our focus has been on the performance.mark() and performance.measure() methods, the Performance API encompasses a broader range of functionalities. These tools can track a variety of metrics beyond just load times, including memory usage, frame rates for animations, and more.
Accurate performance measurements are not just beneficial for immediate analysis and optimization; they can also be logged and tracked over time. This ongoing monitoring is important in a continuously evolving web environment where new updates and changes can impact performance. By regularly logging these metrics, we can establish performance baselines, identify trends and make data-driven decisions to enhance user experience.

Hassan Djirdeh
Hassan is a senior frontend engineer and has helped build large production applications at-scale at organizations like Doordash, Instacart and Shopify. Hassan is also a published author and course instructor where he’s helped thousands of students learn in-depth frontend engineering skills like React, Vue, TypeScript, and GraphQL.
Related Posts
Comments
All articles
Topics
Web MobileMobile
Desktop
Design
Productivity
People
