
Just Another Way to Visualize Your Data Using RadTreeView for Silverlight
Summarize with AI:
For the past couple of days I've been playing with the way RadTreeView renders its items. To be honest, I wasn't looking for any particular outcome. I was doing it just for fun, hoping that something interesting might come out. And it did. I ended up with something quite interesting and it would be a shame not to share it.
Bellow are few screenshots which show the TreeView from its initial state to the point where its deepest item is expanded.
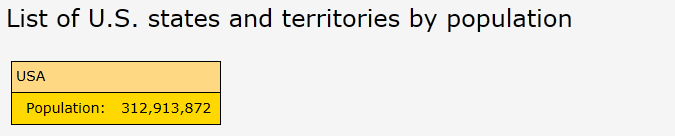
Note: I do lack certain designer skills :)
Download the sample project: USPopulation_Source.zip
Enjoy!
Bellow are few screenshots which show the TreeView from its initial state to the point where its deepest item is expanded.
Note: I do lack certain designer skills :)
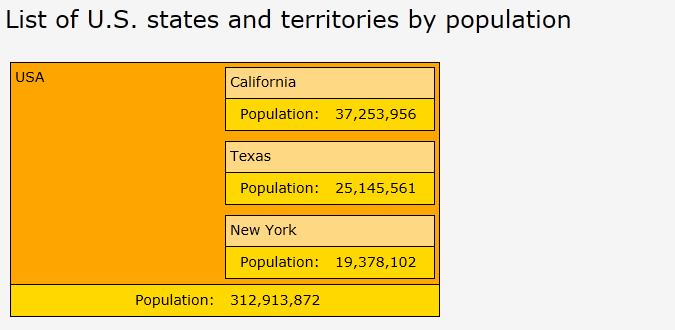
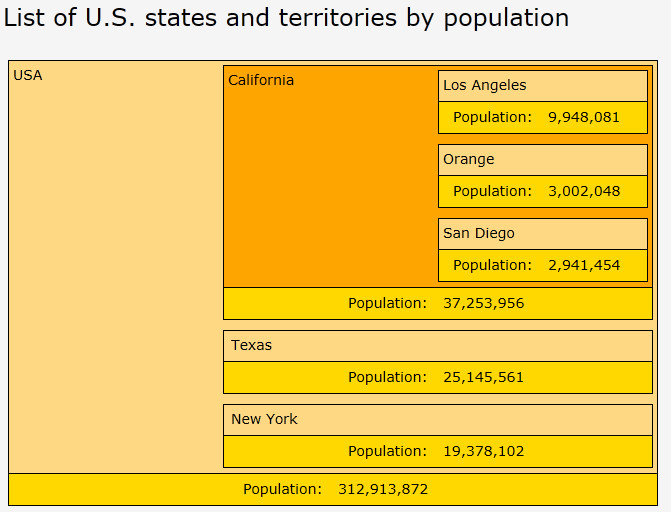
The TreeView is bound to an XML data source which has the following format:
<?xml version="1.0" encoding="UTF-8"?><Items> <XmlNodeItem Header="USA" Value="312,913,872"> <Items> <XmlNodeItem Header="California" Value="37,253,956"> <Items> <XmlNodeItem Header="Los Angeles" Value="9,948,081" /> <XmlNodeItem Header="Orange" Value="3,002,048" /> <XmlNodeItem Header="San Diego" Value="2,941,454" /> </Items> </XmlNodeItem> </Items> </XmlNodeItem></Items>Enjoy!

About the Author
Kiril Stanoev
Hi, I'm Kiril and I'm the Product Manager of Telerik UI for Android, Windows Universal and Windows Phone. Feel free to ping me on +KirilStanoev or @KirilStanoev
Comments
Comments are disabled in preview mode.