# Scatter Chart
The Blazor Scatter chart shows data as points defined by their items' values. Its x-axis is also numerical and does not require categorical items, but numerical values.
Scatter charts are useful for showing the relation between different sets of data, for example scientific (experimental) results.
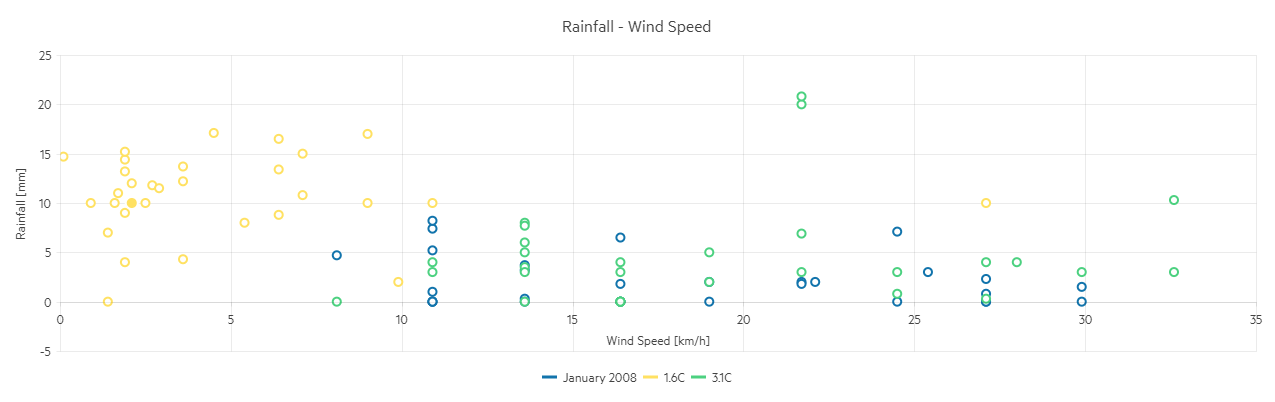
This article assumes you are familiar with the [chart basics](https://www.telerik.com/blazor-ui/documentation/components/chart/overview) and [data binding](https://www.telerik.com/blazor-ui/documentation/components/chart/data-bind).
#### To create a scatter chart:
1. add a `ChartSeries` to the `ChartSeriesItems` collection
2. set its `Type` property to `ChartSeriesType.Scatter`
3. provide a data collection to its `Data` property, which contains numerical data for the X and Y axes
> caption A bubble chart that shows projected population change on a plot of life expectancy versus fertility rate
## Scatter Chart Specific Appearance Settings
### Markers
Each data item is denoted by a marker. You can control its settings through the child `ChartSeriesMarkers` tag of the series.
You can hide the markers by setting their `Visible` property to `false`.
The `Size` property is the size of the marker in pixels.
The `Type` property is a member of the `Telerik.Blazor.ChartSeriesMarkersType` enum:
* `Circle` - the default
* `Cross`
* `Square`
* `Triangle`
The `Rotation` property is the degrees with which the marker is rotated from its default orientation.
### Color
The color of the line and markers is controlled through the `Color` property that can take any valid CSS color (for example, `#abcdef`, `#f00`, or `blue`).
You can control the color of the markers by using the `Background` property of the nested `ChartSeriesMarkers` tag.
#### ColorField
You can pass a `ColorField` to the chart as a part of the model, and the data points (markers) will use that color instead of the `Color` of the series or the `Background` of the markers settings.
### Customize Chart Elements - Nested Tags Settings
When configuring nested properties and child elements in your chart, the inner tags will contain their parent tag name and add specifics to its end. In general the structure of such nested tags will be `` where the Category can be one of the following:
* CategoryAxis
* ChartArea
* Legend
* PlotArea
* SeriesItems
* Title
* Tooltip
* ValueAxis
* XAxes
* YAxes
* and others
> tip To customize the chart, look for nested tags and their properties - the inner tags will contain their parent tag name and add specifics to its end. For example, the `ChartSeries` tag has a `ChartSeriesLabels` tag that exposes configuration options and more child tags.
For example, for [numerical](https://www.telerik.com/blazor-ui/documentation/components/chart/data-bind#series-types) charts you can rotate the Labels for `ChartXAxes` or `ChartYAxes` depending on your application design needs and layout. This can be done through the
`ChartXAxes` > `ChartXAxis` > `ChartXAxisLabelsRotation` tag
where you can set the `Angle` property to the desired value in degrees (they might be negative or positive numbers). By using similar approach you can take control over `ChartXAxisLabelsBorder` (add borders), `ChartXAxisLabelsMargin` (add margin for top, bottom, left and right) and others.
This approach is not limited only to the Labels - it can be used with to all tags that are applicable for the chart type, for example the Chart Title `ChartTitle` > `ChartTitleMargin`.
> tip See the code snippet above to observe setting the title text for the `ChartXAxis` and the `ChartYAxes`.
## See Also
* [Live Demo: Scatter Chart](https://demos.telerik.com/blazor-ui/chart/scatter-chart)