# Donut Chart
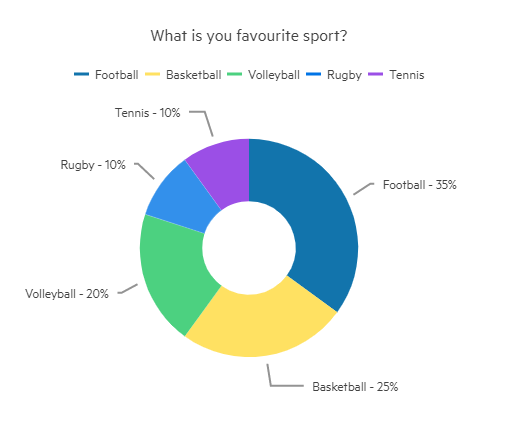
The Blazor Donut chart displays the data as sectors from a two-dimensional circle and is therefore useful for displaying data as parts of a whole. Unlike a pie chart, it can have multiple series in the same chart. There is a hole in the middle of the circle, hence the name of the chart.
This article assumes you are familiar with the [chart basics](https://www.telerik.com/blazor-ui/documentation/components/chart/overview) and [data binding](https://www.telerik.com/blazor-ui/documentation/components/chart/data-bind).
## Creating Donut Chart
1. Add a `ChartSeries` to the `ChartSeriesItems` collection
2. Set its `Type` property to `ChartSeriesType.Donut`
3. Provide a data model collection to its `Data` property
4. Set the `Field` and `CategoryField` properties to the corresponding fields in the model that carry the values and names that will be shown in the legend
If you use [simple data binding](https://www.telerik.com/blazor-ui/documentation/components/chart/data-bind#independent-series-binding) and only provide values, the chart will not render a legend.
> caption A donut chart that shows product revenues
## Donut Chart Specific Appearance Settings
The following sections explain specific configuration options to the donut charts:
* [Rotation](https://www.telerik.com/blazor-ui/documentation/components/chart/types/donut#rotation)
* [Color Field](https://www.telerik.com/blazor-ui/documentation/components/chart/types/donut#color-field)
* [Exploded Segment](https://www.telerik.com/blazor-ui/documentation/components/chart/types/donut#exploded-segment)
* [Visible In Legend](https://www.telerik.com/blazor-ui/documentation/components/chart/types/donut#visible-in-legend)
* [Hole Size](https://www.telerik.com/blazor-ui/documentation/components/chart/types/donut#hole-size)
* [Multiple Series](https://www.telerik.com/blazor-ui/documentation/components/chart/types/donut#multiple-series)
* [Customize Chart Elements - Nested Tags Settings](https://www.telerik.com/blazor-ui/documentation/components/chart/types/donut#customize-chart-elements-nested-tags-settings)
### Rotation
By default, the first segment starts at the top. You can change that by using the `StartAngle` property of the series.
### Color Field
You can control the color of the individual segments of the donut chart by providing a string with the desired color in the model, and setting the `ColorField` of the series to it. You can pass a valid CSS color (for example, `#abcdef`, `#f00`, or `blue`).
### Exploded Segment
You can have some of the segments of the donut chart separated from the rest of the circle with a small margin. This helps bring attention to them as outliers or as important bits that the viewer should focus on.
To explode (separate) a segment, use the `ExplodeField` property of the series and set it to a boolean field that indicates whether the segment is exploded. Only a `true` value explodes a segment, so you can use a nullable field as well and only provide values for the items you want separated.
> caption Exploded Items
### Visible In Legend
You can hide certain segments from the legend (for example, if their contribution is insignificantly small). To do this, add a boolean field to the model and set its name to the `VisibleInLegendField` property of the donut series. The flags in this field will denote whether the particular item will be rendered in the legend.
> caption Hide segments from the legend
### Hole Size
You can change the percentage that the hole in the middle takes from the entire diameter of the circle by setting the `HoleSize` property of the series. Setting `0` removes the hole, and `100` means the entire chart is the hole.
### Multiple Series
Unlike a pie chart, a donut chart can have multiple series in a single chart. Each series is nested in the next - the first declared series is in the center, and the last series is at the outer edge.
You can use multiple series to showcase relationships within a data set, or several similar sets of data.
You can also use the `ColorField` property to define a field with the segments' colors. With this, you can color-code different series and their relationships to one another.
### Customize Chart Elements - Nested Tags Settings
When configuring nested properties and child elements in your chart, the inner tags will contain their parent tag name and add specifics to its end. In general the structure of such nested tags will be `` where the Category can be one of the following:
* CategoryAxis
* ChartArea
* Legend
* PlotArea
* SeriesItems
* Title
* Tooltip
* ValueAxis
* XAxes
* YAxes
* and others
> tip To customize the chart, look for nested tags and their properties - the inner tags will contain their parent tag name and add specifics to its end. For example, the `ChartSeries` tag has a `ChartSeriesLabels` tag that exposes configuration options and more child tags.
For example, for [axis-free](https://www.telerik.com/blazor-ui/documentation/components/chart/data-bind#series-types) charts you can rotate their Labels, Title, Legend and others. Example for doing so is customizing the Chart Series Labels by using the parameters in the
`ChartSeriesItems` > `ChartSeries` > `ChartSeriesLabels` tag and its child tags.
This approach is not limited only to the Labels - it can be used with to all tags that are applicable for the chart type, for example the Chart Title `ChartTitle` > `ChartTitleMargin`.
> caption Customize Chart Title Margin, Series Label Font, and Borders
The following example shows how to use the Chart `Height`, Series `Size`, and Legend `Height` to arrange a layout with a larger number of donut segments.
> caption Customize Donut Chart element dimensions
## See Also
* [Live Demo: Donut Chart](https://demos.telerik.com/blazor-ui/chart/donut-chart)
* [Hide Donut Chart Category on Legend Click](https://www.telerik.com/blazor-ui/documentation/knowledge-base/chart-toggle-category-on-legend-item-click)