# Candlestick Chart
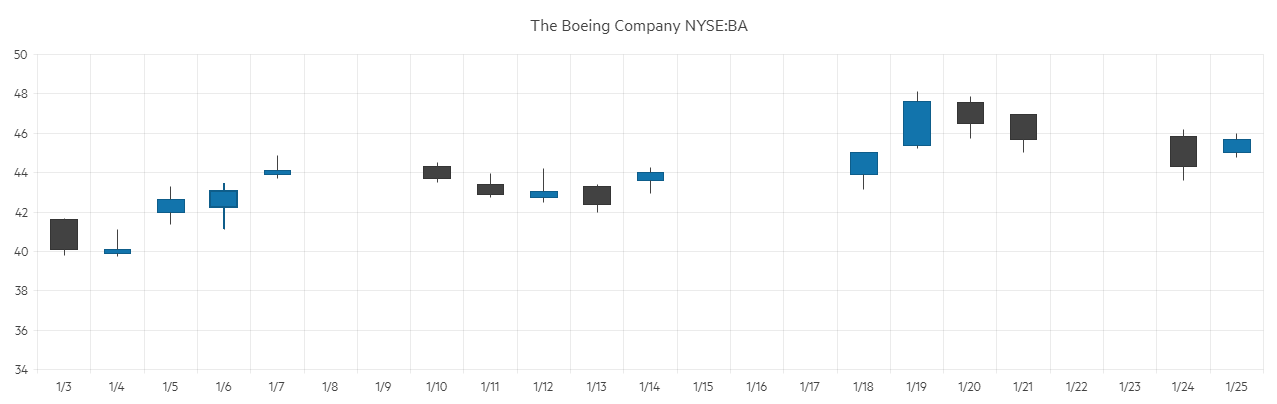
The Candlestick chart shows data for the movement of the price of a financial unit. It consists of a bar (the candle), representing the open and close values, and vertical lines, the candlesticks, which illustrate the highest and lowest values.
This article assumes you are familiar with the [chart basics](https://www.telerik.com/blazor-ui/documentation/components/chart/overview) and [data binding](https://www.telerik.com/blazor-ui/documentation/components/chart/data-bind).
#### To create a candlestick chart:
1. add a `ChartSeries` to the `ChartSeriesItems` collection
2. set its `Type` property to `ChartSeriesType.Candlestick`
3. provide a data collection to its `Data` property and set the corresponding fields:
* `CategoryField` - the date that will be matched to the x-axis
* `OpenField` - the field with the Open value
* `CloseField` - the field with the Close value
* `HighField` - the field with the High value
* `LowField` - the field with the Low value
4. make the x-axis a [Date axis](https://www.telerik.com/blazor-ui/documentation/components/chart/date-axis) - while the candlestick chart can work with simple string categories, it is designed to show financial data over time
> caption A Candlestick chart that shows product financial stock data
## Candlestick Chart Specific Appearance Settings
### DownColor
Set the color - a valid CSS, RGB, RGBA color - of the series when the `OpenField` is greater than the `CloseField` by setting the `DownColor` property of the `ChartSeries`. This can be passed through the data model and bound to the `DownColorField`.
### Color Field
Column, OHLC and Candlestick charts can take the color of the series item from the `ColorField` of the data source. You can pass a valid CSS color (for example, `#abcdef`, `#f00`, or `blue`).
> note The values bound to `DownColorField` and `ColorField` will take precedence over the values passed to the `Color` and the `DownColor` attributes.
### Gap and Spacing
You can control the distance between the categories that cluster a data point from each series. To do this, use the `Gap` property of the series. It is the distance between categories expressed as a percentage of the bar width.
To set the distance between the bars of different series in the same category, use the `Spacing` property. It is the space between the series items in one series category as a proportion of the width of a single series item.
To create overlap, set negative values.
You can configure the values of `Gap` and `Spacing` for the whole chart in the first series and they are applied for all categories and series items.
### Customize Chart Elements - Nested Tags Settings
When configuring nested properties and child elements in your chart, the inner tags will contain their parent tag name and add specifics to its end. In general the structure of such nested tags will be `` where the Category can be one of the following:
* CategoryAxis
* ChartArea
* Legend
* PlotArea
* SeriesItems
* Title
* Tooltip
* ValueAxis
* XAxes
* YAxes
* and others
> tip To customize the chart, look for nested tags and their properties - the inner tags will contain their parent tag name and add specifics to its end. For example, the `ChartSeries` tag has a `ChartSeriesLabels` tag that exposes configuration options and more child tags.
## See Also
* [Live Demo: Candlestick Chart](https://demos.telerik.com/blazor-ui/chart/candlestick-chart)