How To Use a Web Debugging Proxy Tool to Eliminate Errors Fast

Looking for ways to compose tests and mock scenarios? Let’s discuss an approach that is holistic in nature and involves using a web debugging proxy tool.
When is the last time you visited a website and received a failing request or were presented with a server failure scenario? The reason this happens is because of coding errors that manifest into real problems. If it keeps happening, you are likely to lose users—and fast. And loss of visitors many times equates to loss of revenue.
Coding errors can be extremely costly, and it’s critical that we find them and fix them, and that we keep searching them out to keep our applications running smoothly from Day One.
There are many ways to compose tests and mock scenarios. The approach that we’ll cover in this article is holistic in nature and involves using a web debugging proxy tool.
What Is Web Debugging?
Web debugging is a series of steps that reveals an error in you application. By inspecting your HTTP(S) network traffic, you can capture requests and responses to identify bugs. Then you can narrow in on the root cause and present the fix. Once an error is fixed, you can use web debugging proxy to test it again, before having to make the needed changes the code.
It’s not easy to track down network issues—the sheer magnitude of requests coming in can make it feel like looking for a needle in a haystack. While the process can appear daunting at first, there are solutions to break it down to a more manageable operation and deliver the outcomes you are expected to deliver.
Let’s cover a few reasons why every developer, QA and support engineer needs a solid path when it comes to debugging traffic—whether it be on Windows, macOS or Linux.
Why Do We Need to Debug Network Traffic?
Building your app and releasing it without adequate testing is not something you can get away with anymore. Systems have become more complex and, to test the quality of your app, there are steps you need to take, and debugging network traffic is an important part of your development and release strategy. Here are a few reasons why it matters:
-
Inspecting and monitoring network traffic allows you to proactively discover and analyze bugs before they build up into a mess that is difficult to manage.
-
Debugging removes the guesswork. I like to say, “You can’t solve what you can’t see.” And that’s exactly why a web debugging proxy tool is so important. You can pinpoint the precise trouble spot in your code—and to understand the root cause of the issue—and then solving it is significantly easier.
-
With a web debugging proxy tool, your network traffic is reviewed in parts, making errors more evident, but also helping you to ensure each part of your app is scanned and ready for prime time.
What Steps Should I Take To Debug My Web App?
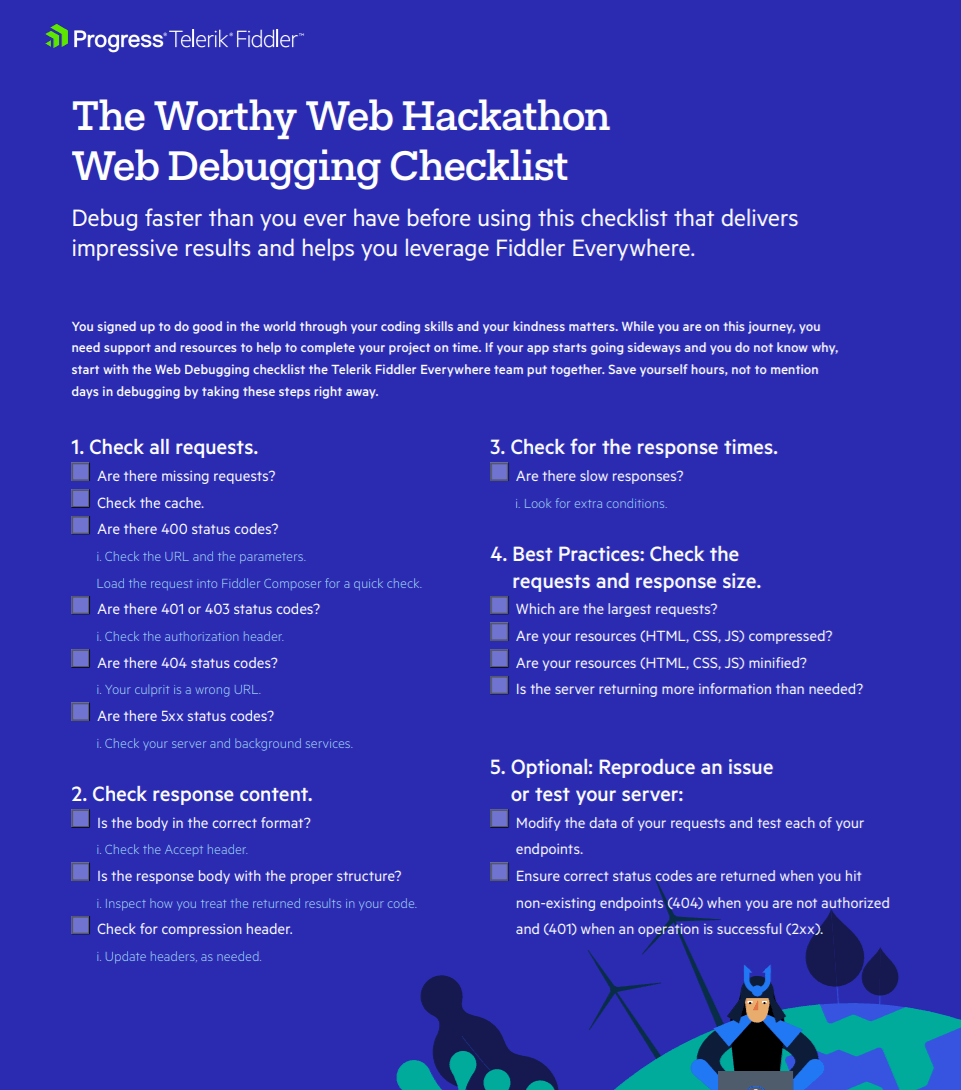
Follow these recommended steps in the Telerik Fiddler Everywhere team’s handy Web Debugging Checklist, and you’ll be back in business in no time:
1. Check All Requests.
-
Are there missing requests?
-
Check the cache.
-
Are there 400 status codes?
- Check the URL and the parameters.
- Load the request into Fiddler Composer for a quick check. -
Are there 401 or 403 status codes?
- Check the authorization header. -
Are there 404 status codes?
- Your culprit is a wrong URL. -
Are there 5xx status codes?
- Check your server and background services.
2. Check Response Content.
-
Is the body in the correct format?
- Check the Accept header. -
Is the response body with the proper structure?
- Inspect how you treat the returned results in your code. -
Check for compression header.
- Update headers, as needed.
3. Check for the Response Times.
-
Are there slow responses?
- Look for extra conditions.
4. Best Practices: Check the Requests and Response Sizes.
-
Which are the largest requests?
-
Are your resources (HTML, CSS, JS) compressed?
-
Are your resources (HTML, CSS, JS) minified?
-
Is the server returning more information than needed?
5. Optional: Reproduce an Issue or Test Your Server.
-
Modify the data of your requests and test each of your endpoints.
-
Ensure correct status codes are returned when you hit non-existing endpoints (404) when you are not authorized and (401) when an operation is successful (2xx).
Here’s a handy PDF download of this list.
Try Our Web Debugging Proxy Tool Today
Progress Telerik is working hard to provide the very best in web debugging. We’d invite you to learn more about Fiddler Everywhere, or see for yourself how easy web debugging can be with Fiddler Everywhere with a free 30-day trial.

Eve Turzillo
Eve is a senior developer advocate at Progress and is enthralled in everything to do with web debugging and the world of network traffic. When not writing content or streaming, you can find her at your favorite developer events.

