# Tooltips
The HeatMap provides a tooltip behavior which visualizes arbitrary information related to a data point.
The tooltip functionality is disabled by default. To enable it, set the `ShowToolTips` property of the HeatMap to `true`.
#### **Enable the tooltip behavior of the HeatMap**
```XAML
```
## Customizing the Tooltip
To customize the appearance of the tooltip, use the `ToolTipSettings` property of the `RadHeatMap`. It is of type `HeatMapToolTipSettings` and exposes the following properties:
* `ToolTipTemplate`—The template that will be used for the tooltips.
* `ShowDuration`—A value that determines how long the tooltip will be visible before disappearing.
* `InitialShowDelay`—The length of time before a tooltip opens.
* `Placement`—The orientation of the tooltip when it opens. Specifies the behavior of the tooltip when it overlaps screen boundaries.
* `PlacementRectangle`—The rectangular area relative to which the tooltip is positioned.
* `PlacementTarget`—The object relative to which the tooltip is positioned.
* `HorizontalOffset`—The offset from the left of the area that is specified for the tooltip by the `PlacementRectangle` and `PlacementTarget` properties.
* `VerticalOffset`—The distance from the top of the area that is specified for the tooltip by the `PlacementRectangle` and `PlacementTarget` properties.
* `ToolTipFormat`—The tooltip format string.
## Implementing the Tooltip in the HeatMap
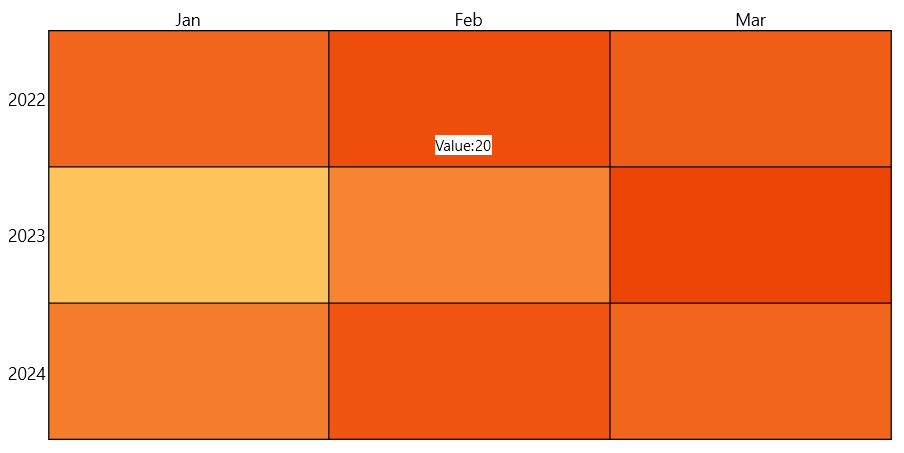
For the purposes of this article, you'll use the `TempInfo` and `ViewModel` classes from the article on [populating the HeatMap with data](https://www.telerik.com/winui/documentation/controls/radheatmap/populating-with-data). After having the sample data ready, go to the XAML code and define the HeatMap and the `ToolTipSettings`.
#### **Customize the tooltip**
```XAML
```
**A HeatMap with a customized tooltip**
## See Also
* [Getting Started with the Telerik UI for WinUI HeatMap](https://www.telerik.com/winui/documentation/controls/radbadge/getting-started)
* [Telerik UI for WinUI Demos](https://demos.telerik.com/winui/)