# Getting Started with WinUI DataBar
This tutorial will walk you through the required steps for using **RadDataBar**.
## Assembly References
In order to add **RadDataBar** in your application, you need to add references to the following assemblies:
* `Telerik.WinUI.Controls.dll`
* `Telerik.Licensing.Runtime.dll`
## Visualization Types
The RadDataBar suite contains the following controls representing the different visualizations.
* **RadDataBar**: Displays a single data bar representing a value. It is useful for comparing quantitative values of data. You can easily highlight negative values.
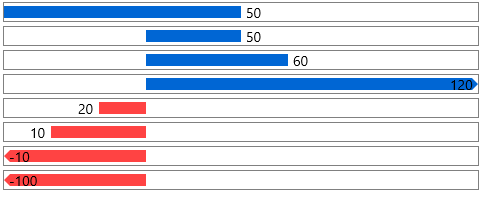
* **RadStackedDataBar**: Displays a set of stacked bars where each bar represents a value. The size of each bar is calculated in accordance to the set Minimum and Maximum properties.

* **RadStacked100DataBar**: Displays a set of stacked bars where each value represents a percentage of the value. The percent is calculated based on the bar's value and the sum of all values in the stack.

## Using RadDataBar
To display a data bar visualization, you can just add a RadDataBar control in the view and set its **Value** property. This will create a horizontal bar measured according to the Value. The value range of the bar is defined by its **Minimum** and **Maximum** properties, which default values are 0 an 100 respectively.
> You can access the RadDataBar controls through an alias pointing to the Telerik.UI.Xaml.Controls.DataVisualization namespace: xmlns:dataVisualization="using:Telerik.UI.Xaml.Controls.DataVisualization"
#### **Example 1: Defining RadDataBar**
```XAML
```

## Using RadStackedDataBar
To display a stacked data bar visualization, you can add a **RadStackedDataBar** control in the view and set its **ItemsSource** property. This will create a set of stacked horizontal bars measured according to the values in the ItemsSource. The value range of the bar is defined by its **Minimum** and **Maximum** properties, which default values are 0 an 100 respectively.
#### **Example 2: Defining RadStackedDataBar**
```XAML
```
#### **Example 3: Setting RadStackedDataBar ItemsSource**
```C#
public MyUserControl()
{
InitializeComponent();
this.stackedDataBar.ItemsSource = new List() { 16, 20, 12, 32 };
}
```

## Using RadStacked100DataBar
The **RadStacked100DataBar** works very similar to the **RadStackedDataBar**, but instead of using absolute values and relying on the predefined minimum and maximum values, it displays the bars as a percetange of the whole stack. For example, the sum of the values from **Example 3** is `16 + 20 + 12 + 32 = 80` which will be the range's maximum. Then each value in the ItemsSource is turned to a value relative to the range and based on this information its bar's width is calculated. For example, 20 will be 0.25 which is 25% of the 80's range. This means that the bar for the value 20 will take 25% of the whole data bar.
To define RadStacked100DataBar, use Example 2 and 3, but replace the RadStackedDataBar with RadStacked100DataBar.
#### **Example 4: Defining RadStacked100DataBar**
```XAML
```

## Telerik UI for WinUI Learning Resources
* [Telerik UI for WinUI DataBar Component](https://www.telerik.com/winui/databar)
* [Getting Started with Telerik UI for WinUI Components](https://www.telerik.com/winui/documentation/getting-started/first-steps-nuget)
* [Telerik UI for WinUI Installation](https://www.telerik.com/winui/documentation/installation-and-deployment/installing-which-file-do-i-need)
* [Telerik UI for WinUI Examples](https://www.telerik.com/winui/documentation/examples/demos-app)
* [Telerik UI for WinUI Accessibility](https://www.telerik.com/winui/documentation/common/accessibility)
* [Telerik UI for WinUI License Agreement](https://www.telerik.com/purchase/license-agreement/winui)
## See Also
* [Properties](https://www.telerik.com/winui/documentation/controls/raddatabar/properties-configuration)
* [Data Binding](https://www.telerik.com/winui/documentation/controls/raddatabar/databinding)