# Scale Ticks

The BulletGraph enables you to control the appearance of its scale ticks.

## Tick Interval

To set the interval between two adjacent ticks on the scale, use the `TickStep` property.

#### **Set the TickStep**

```XAML
<Grid xmlns:dataVisualization="using:Telerik.UI.Xaml.Controls.DataVisualization">
	<dataVisualization:RadBulletGraph Height="50" Width="300" StartValue="0" EndValue="100" TickStep="25" />
</Grid>
```

The following image shows a `TickStep` set to `25`.

![WinUI RadBulletGraph RadBulletGraph-TickStep](https://www.telerik.com/winui/documentation/assets/453e9b7201c75b41bf5214a4d858bd37/radbuletgraph-tickstep.png)

## Styling the Ticks

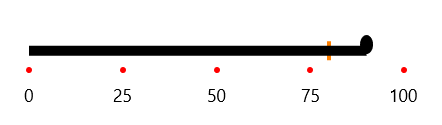
To change the appearance of the scale ticks, use the `TickTemplate` property.

#### **Set the TickTemplate**

```XAML
<Grid xmlns:dataVisualization="using:Telerik.UI.Xaml.Controls.DataVisualization">
	<dataVisualization:RadBulletGraph Height="50" Width="300" StartValue="0" EndValue="100" TickStep="25">
		<dataVisualization:RadBulletGraph.TickTemplate>
			<DataTemplate>
				<StackPanel Orientation="Horizontal">
					<Ellipse Fill="Red" Height="5" Width="5"/>         
				</StackPanel>
			</DataTemplate>
		</dataVisualization:RadBulletGraph.TickTemplate>
	</dataVisualization:RadBulletGraph>
</Grid>
```

The following image shows the result.
![WinUI RadBulletGraph RadBulletGraph-TickTemplate](https://www.telerik.com/winui/documentation/assets/416cd5c7e33bfe883d6590413b51d005/radbuletgraph-ticktemplate.png)
