# Clustering
Many applications operate with collections of items which are placed close to others and it's uncomfortable to use them as separate objects for low zoom levels. The **VisualizationLayer** supports the **Clustering** feature. It allows grouping of items according to condition.
## Using of the clustering
The **VisualizationLayer** exposes the following properties which are related to the **Clustering** feature:
* **ClusterGenerator**: Gets or sets an instance of the class which implements the **IClusterGenerator** interface. It can be used when you want to define your own grouping algorithm. As default it uses the instance of the built-in **DefaultClusterGenerator** class.
* **ClusteringEnabled**: Gets or sets a **boolean** value which indicates whether the clustering is enabled.
* **ClusteringEnabledThreshold**: A property of type **int** that gets or sets clustering enabled threshold. This value sets the max zoom level for clustering. If current zoom level of the control is greater than this value then clustering will be disabled.
> tip You should set the **AutoCalculateClusteringThreshold** to **False** to allow the RadMap to respect the **ClusteringEnabledThreshold**. The default value of this property is **True**. This means that you need to explicitly set it to false in all cases when you need to predefine the clustering threshold.
* **ClusteringEnabledThresholdMinItems**: A property of type **int** that gets or sets the minimum number of items in the cluster for auto calculated clustering threshold. The clustering threshold will be set if number of the items in every cluster is less than this value.
* **ClusterItemTemplate**: Gets or sets the data template which represents the cluster item.
* **ClusterTemplateSelector**: Gets or sets the custom logic for choosing a template used to display each cluster.
* **DefaultClusterTemplate**: Gets or sets the default cluster data template. It’s used when the **ClusterTemplateSelector** and **ClusterItemTemplate** properties are not specified.
* **GenerateClustersOnZoom**: A property of type **bool** that gets or sets value which indicates whether clusters should be re-generated when the zoom level is changed. The default value of this property is **true**.
In order to enable the **Clustering** feature you can specify just the **ClusteringEnabled** property to **true**. Also you can configure the **ItemTemplate** and **ClusterItemTemplate** properties for customizing the appearance of the item and of the cluster.
More information about using of the **ItemTemplate** property you can find in the [Data Binding](https://www.telerik.com/products/wpf/documentation/controls/radmap/features/visualization-layer/data-binding) article.
## ClustersInvalidated Event
To get notified when the cluster elements are created, the **ClustersInvalidated** event of the VisualizationLayer can be utilized.
**Example 1: Subscribe to ClustersInvalidated event**
```XAML
```
**Example 2: ClustersInvalidated event handler**
```C#
private void VisualizationLayer_ClustersInvalidated(object sender, System.EventArgs e)
{
// custom logic
}
```
## Items Grouping Example
The following example demonstrates how to use the **Clustering** feature to display the airports of USA. The example displays the point type data which can be found in the “airports” shape-file of our [Virtualization and Grouping](https://demos.telerik.com/wpf/#Map/ClusterVirtualization) demo. The file contains 940 airports.
If you try to load this file using the shape-file reader directly, like the sample XAML code below, then the performance of zooming and panning will be slow. Also the data items will be overlapped for low zoom levels (1-7).
**Example 3: Displaying Airports of USA**
```XAML
```
Here is a snapshot of the displayed items for zoom level 3:
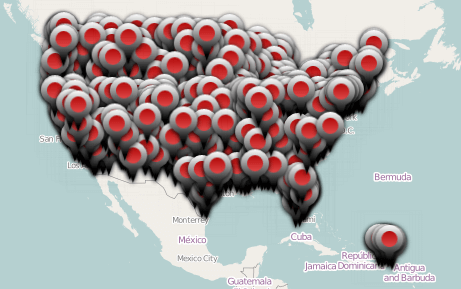
Such performance is a reason to use the **Clustering** feature to improve the performance of rendering. Also, it allows to avoid displaying the overlapped objects which are placed close to others.
You can set the **ClusteringEnabled** property to **true** for enabling the feature.
**Example 4: Enable clustering functionality**
```XAML
```
Here is a snapshot of the displayed items for zoom level 3 when the grouping is used:
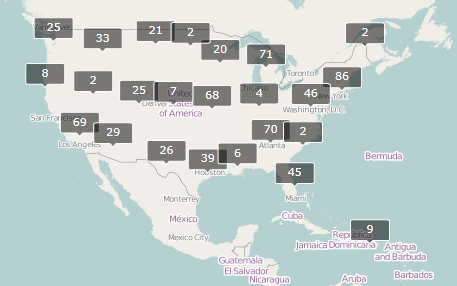
By default the cluster looks like above and it shows how many items it contains.
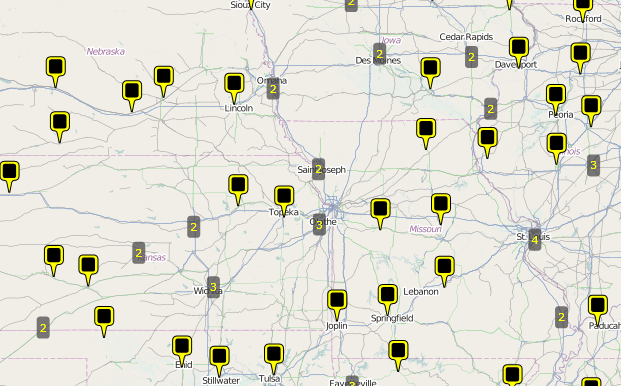
You can configure the **ItemTemplate** and **ClusterItemTemplate** properties to customize the appearance of the item and of the cluster.
**Example 5: Customizing the appearance of the cluster**
```XAML
```
There are the results of using custom templates for clusters and items:

## DefaultClusterGenerator class
The VisualizationLayer has an **IClusterGenerator** instance member which is responsible for the clustering behavior. By default it uses an instance of the built-in **DefaultClusterGenerator class**. This class can be used to customize the default grouping algorithm. The **DefaultClusterGenerator class** exposes the following properties:
* **AutoExpandWhenSingle:** A property of type **Boolean** that gets or sets the value which indicates whether cluster should be automatically expanded when it contains one data item only.
* **CloseDistance:** A property of type **double\[]** that gets or sets an array of the doubles which every item define the max distance between the cluster center and the item for the corresponding ZoomLevel.
* **DeleteWhenEmpty:** A property of type **Boolean** that gets or sets the value which indicates whether cluster should be deleted if it is empty.
* **ExpandRadius:** A property of type **double** that gets or sets the radius (in pixels) which will be used to calculate coordinates of the items when a cluster is expanded to the polygon vertices.
* **HideExpanded:** A property of type **Boolean** that gets or sets whether expanded cluster should be hidden or not.
* **Layer:** A property of type **VisualizationLayer** that gets or sets layer which the current map belongs to.
The **DefaultClusterGenerator** class also provides several methods which can be overridden in order to further customize the clustering algorithm.
* **CreateCluster(Location center, object item):** This method creates a cluster at the specified location.
* **IsItemInClusterRegion(ClusterData cluster, MapObjectInfo info, int zoomLevel):** This method checks if a data item belongs to a given cluster.
* **RegenerationNeeded(ClusterData cluster, int zoomLevel)**: This method can be overridden so you can customize if given cluster should be regenerated at a given zoom level. The default value is **true**.
## The ClusterData object
The **VisualizationLayer** uses the **ClusterData** object to visualize the cluster. The **ClusterData** exposes the following properties which can be used in applications:
* **AutoCalculateBounds**: Gets or sets value which indicates whether bounding box of the cluster should be calculated automatically.
* **AutoExpandWhenSingle**: Gets or sets value which indicates whether cluster should be automatically expanded when it contains 1 data item only.
* **Bounds**: Gets or sets bounding box of the cluster.
* **Children**: Gets data items which belong to this cluster.
* **ClusterState**: A property of type **ClusterState** that gets or sets state of the cluster. It can be **Collapsed**, **Expanded** and **ExpandedToPolygon**. The difference between expanded cluster and cluster expanded to polygon is as following: the expanded cluster uses original locations of the items to show them, the cluster which is expanded to polygon uses vertices of the regular polygon with center at the cluster’s center to show items.
* **Count**: Gets number of the items in the cluster.
* **Data**: Gets or sets additional cluster's data. This data can be used to pass extra information to the cluster's data template or by cluster generator when detecting belonging of the item to the particular cluster.
* **DeleteWhenEmpty**: Gets or sets value which indicates whether cluster should be deleted if it is empty.
* **ExpandRadius**: Gets or sets radius (in pixels) which will be used to calculate coordinates of the items when cluster is expanded to the polygon vertices.
* **HideExpanded**: Gets or sets value which indicates whether the expanded cluster should be hidden.
* **Hotspot**: Gets or sets hotspot of the cluster.
* **Location**: Gets or sets center of the cluster.
* **ZIndex**: Gets or sets the Z-Index of the cluster.
Many of these properties are used by the cluster generator, only. It calculates them automatically during the process of generating clusters. Usually, applications use the **ClusterState** property to expand the cluster’s items. The following example demonstrates how this can be achieved.
## Expand Cluster Example
The **ClusterState** property allows displaying the items of cluster without increasing of the zoom level. You can attach the mouse events in the cluster template like the XAML code below.
**Example 6: Subscribing to MouseLeftButtonDown and MouseRightButtonDown events**
```XAML
```
The following *MouseLeftButtonDown* event handler uses to expand the items of cluster to the polygon vertices:
**Example 8: MouseLeftButtonDown event handler**
```C#
private void ExpandClusterToPolygon(object sender, MouseButtonEventArgs e)
{
FrameworkElement element = sender as FrameworkElement;
if (element != null)
{
ClusterData data = element.DataContext as ClusterData;
if (data != null)
{
if (data.ClusterState != ClusterState.ExpandedToPolygon)
{
data.HideExpanded = false;
data.ClusterState = ClusterState.ExpandedToPolygon;
}
else
{
data.ClusterState = ClusterState.Collapsed;
}
}
}
e.Handled = true;
}
```
```VB.NET
Private Sub ExpandClusterToPolygon(sender As Object, e As MouseButtonEventArgs)
Dim element As FrameworkElement = TryCast(sender, FrameworkElement)
If element IsNot Nothing Then
Dim data As ClusterData = TryCast(element.DataContext, ClusterData)
If data IsNot Nothing Then
If data.ClusterState <> ClusterState.ExpandedToPolygon Then
data.HideExpanded = False
data.ClusterState = ClusterState.ExpandedToPolygon
Else
data.ClusterState = ClusterState.Collapsed
End If
End If
End If
e.Handled = True
End Sub
```
The following *MouseRightButtonDown* event handler uses to expand the items of cluster to their original locations:
**Example 9: MouseRightButtonDown event handler**
```C#
private void ExpandCluster(object sender, MouseButtonEventArgs e)
{
FrameworkElement element = sender as FrameworkElement;
if (element != null)
{
ClusterData data = element.DataContext as ClusterData;
if (data != null)
{
if (data.ClusterState != ClusterState.Expanded)
{
data.HideExpanded = false;
data.ClusterState = ClusterState.Expanded;
}
else
{
data.ClusterState = ClusterState.Collapsed;
}
}
}
e.Handled = true;
}
```
```VB.NET
Private Sub ExpandCluster(sender As Object, e As MouseButtonEventArgs)
Dim element As FrameworkElement = TryCast(sender, FrameworkElement)
If element IsNot Nothing Then
Dim data As ClusterData = TryCast(element.DataContext, ClusterData)
If data IsNot Nothing Then
If data.ClusterState <> ClusterState.Expanded Then
data.HideExpanded = False
data.ClusterState = ClusterState.Expanded
Else
data.ClusterState = ClusterState.Collapsed
End If
End If
End If
e.Handled = True
End Sub
```
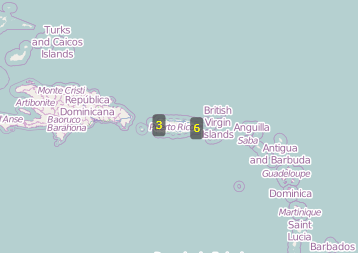
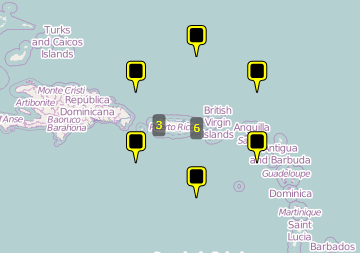
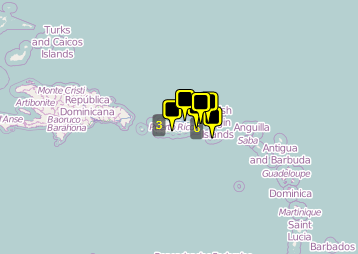
In the snapshots below you can see how the above example will be displayed using different **ClusterState** values. The **ClusterState** of cluster which contains six items is **Collapsed**.
The **ClusterState** value is **ExpandedToPolygon**.
The **ClusterState** value is **Expanded**.
## See Also
* [Reading Map Shapes](https://www.telerik.com/products/wpf/documentation/controls/radmap/features/visualization-layer/reading-map-shapes)