# Styling the Chart Series
There are four ways to style the chart series. The first and easier one is to use the shortcut visual properties of the ISeriesDefinition interface. The second is to use the complex styles property provided by the **ChartArea** of the **RadChart** , the third is to use Palette Brushes and the forth is to retemplate the default series style.
## Styling the Series via the SeriesDefinition classes
This is the easiest approach that you can use in order to style the chart series. It uses the shortcut visual properties exposed by the **ISeriesDefinition** interface. These properties can be found under the **Appearance** complex property for each one of the series. Here is a list of them:
* **Fill** - gets or sets the brush that describes the fill for the corresponding chart series type.
* **Stroke** - gets or sets the brush that describes the stroke for the corresponding chart series type.
* **StrokeThickness** - stroke thickness for the corresponding chart series type.
> For series that have no concept of **Fill** such as **Line**, **Spline**, **Stick**, etc. the **Stroke/StrokeThickness** value is the brush that defines the appearance of the whole visual segment.
* **Cursor** - gets or sets the mouse cursor that appears when the mouse pointer hovers over a chart series item element.
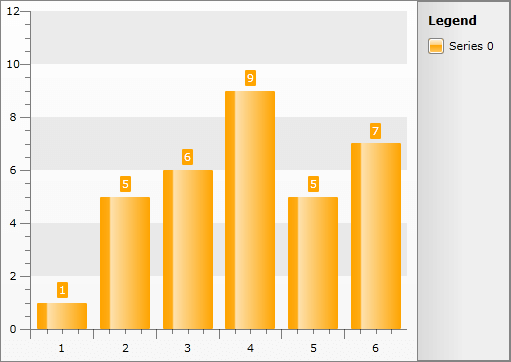
For example, you can change the appearance of a **BarSeries** in the following way.
```C#
BarSeriesDefinition barDefinition = new BarSeriesDefinition();
barDefinition.Appearance.Fill = new SolidColorBrush( Colors.Orange );
this.radChart.DefaultSeriesDefinition = barDefinition;
```
```VB.NET
Dim barDefinition As New BarSeriesDefinition()
barDefinition.Appearance.Fill = New SolidColorBrush(Colors.Orange)
Me.radChart.DefaultSeriesDefinition = barDefinition
```
## Styling the Series via Styles
The second way is to define a style and set it through the **SeriesStyles** complex property of the **ChartArea**. It contains style entries for all distinct series types. These types can be divided in two groups - **Self-Drawing (Continuous) Series** and **Item-Drawn (Discrete) Series**.
> Using this type of styling only the series elements will get customized, the item labels and the legend items will remain with their default appearance.
> tip By setting the **Styles** this way, they will get applied to every series of this type. In order to use styles and apply them to certain series you can combine the two methods. This is done by setting them to the **SeriesDefinition.ItemStyle** property for item-drawn series or the **SeriesDefinition.SeriesStyle** property for self-drawn series.
* To create a style for the **Self-Drawing Series** (Line, StackedLine, Spline, StackedSpline, Area, StackedArea, StackedArea100, SplineArea, StackedSplineArea, StackedSplineArea100, Range, SplineRange) you have to create a style that targets the **SelfDrawingSeries** class in the **Telerik.Windows.Controls.Charting** namespace.
```XAML
```
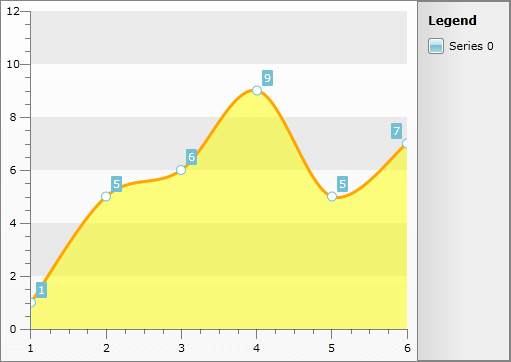
The type exposes two style properties - **BorderLineStyle** and **BackgroundStyle**. The **BorderLineStyle** is **obligatory**, as it defines the main chart contour. The **BackgroundStyle must be** set when your chart represents an area. Here is an example:
```XAML
```
```C#
this.radChart.DefaultView.ChartArea.SeriesStyles.SplineAreaSeriesStyle = this.Resources[ "SplineAreaStyle" ] as Style;
```
```VB.NET
Me.radChart.DefaultView.ChartArea.SeriesStyles.SplineAreaSeriesStyle = TryCast(Me.Resources("SplineAreaStyle"), Style)
```
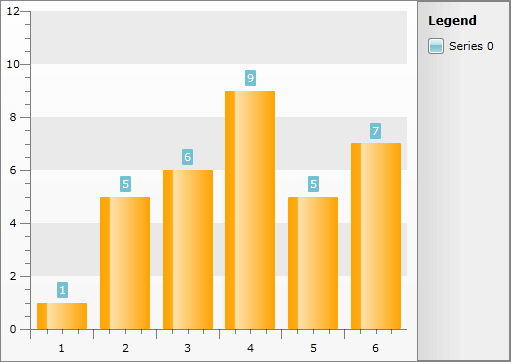
* To create a style for the **Item-Drawn Series** (Bar, StackedBar, StackedBar100, HorizontalBar, HorizontalStackedBar, HorizontalStackedBar100, Pie, Doughnut, Stick, CandleStick, Bubble) you have to create a style that targets the **Shape** class.
Here is an example:
```XAML
```
```C#
this.radChart.DefaultView.ChartArea.SeriesStyles.BarSeriesStyle = this.Resources[ "BarStyle" ] as Style;
```
```VB.NET
Me.radChart.DefaultView.ChartArea.SeriesStyles.BarSeriesStyle = TryCast(Me.Resources("BarStyle"), Style)
```
> tip To learn how to change the foreground of the item's label when using styles take a look at the [Styling the Item Labels](https://www.telerik.com/products/wpf/documentation/controls/radchart/styles-and-templates/styling-and-appearance-styling-item-labels) topic.
## Styling Series via PaletteBrushes
The **RadChart** exposes two **BrushCollections**:
* **RadChart.PaletteBrushes** - defines the brushes used for the series **RadChart** -wide.
* **RadChart.DefaultView\.ChartArea.PaletteBrushes** - defines the brushes used for the series for the specific **ChartArea**.
> tip The **PaletteBrushes** property is independent of the series type.
> The **PaletteBrush** collection on the **ChartArea** level takes precedence over the one on the **RadChart** level and the latter takes precedence over the theme resources.
The **PaletteBrushes** is read-only and allows you to specify a set of brushes that will be applied to the series displayed in the **RadChart**. The pattern of applying is as follows: first series - first brush, second series - second brush.
```XAML
```
or
```XAML
```
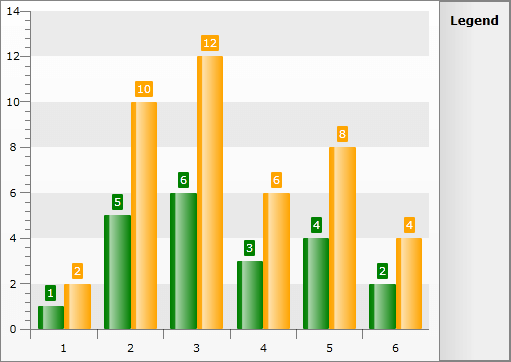
There are **PaletteBrushesRepeat** properties in both **RadChart** and **ChartArea**, which define the behavior of the palette. When **N** brushes are added, then the first **N** series will use those brushes. If **PaletteBrushesRepeat** is set to **True**, then the next **N** series will again use the same colors. When set to **False**, the next series will fallback to use the other available resources.
> For example if you use the **ChartArea** **PaletteBrush** collection with **PaletteBrushesRepeat** set to **False**, when all of the brushes get used, the next series will fallback to the **RadChart** **PaletteBrushes** and after them to the theme resources.
```XAML
```
or
```XAML
```
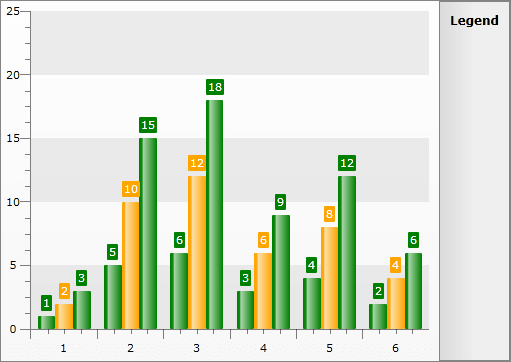
> tip You can set the **PaletteBrushesUseSolidColors** property to true so that those Themes that have *Gradient* colors will have their Gradients set to the SolidColors as given in the Palette. Such themes are *Vista*, *Summer* and *Windows7*. For comparison you may take a look at the following two pictures:
* PaletteBrushesUseSolidColors = *False* and Theme is set to Vista:
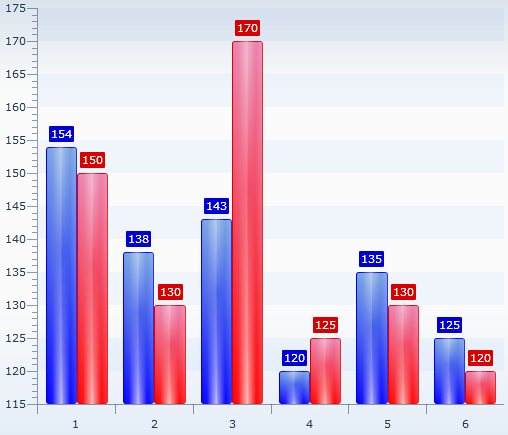
* PaletteBrushesUseSolidColors = *True* and Theme is set to Vista:
Styling Series via Retemplating
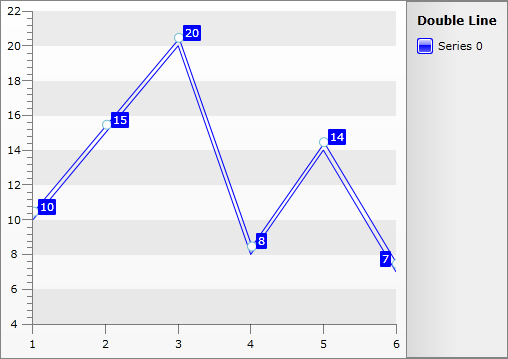
If you want to see a double line when you create new LineSeriesDefinition the onliest way to do this is by retemplating the default Line Style. The double line appearance can be achieved by Transforming the Line by Y with Value -8 for example. The default Line **Fill**, **Stroke** and **StrokeThickness** values of the LineSeries should be set so that they are same as the properties defined in the Style. Additionally you can style the point marks so that their color equals the one set in the Style as shown in our help topic [Styling the Point Marks](http://www.telerik.com/help/silverlight/radchart-styling-and-appearance-styling-point-marks.html).
Here is an example:
```XAML
```
> tip The Default Style is different for RadChart with version older than Q1 2010.
```C#
RadChart1.DefaultSeriesDefinition = line;
line.Appearance.Stroke = new SolidColorBrush(System.Windows.Media.Colors.Blue);
line.Appearance.Fill = new SolidColorBrush(System.Windows.Media.Colors.Blue);
line.Appearance.StrokeThickness = 1;
line.ItemStyle = this.Resources["MyDoubleLineStyle"] as Style;
```
```VB.NET
RadChart1.DefaultSeriesDefinition = line
line.Appearance.Stroke = New SolidColorBrush(System.Windows.Media.Colors.Blue)
line.Appearance.Fill = New SolidColorBrush(System.Windows.Media.Colors.Blue)
line.Appearance.StrokeThickness = 1
line.ItemStyle = TryCast(Me.Resources("MyDoubleLineStyle"), Style)
```
## See Also
* [Styling the Chart Area](https://www.telerik.com/products/wpf/documentation/controls/radchart/styles-and-templates/styling-and-appearance-styling-chart-area)
* [Styling the Chart Legend](https://www.telerik.com/products/wpf/documentation/controls/radchart/styles-and-templates/styling-and-appearance-styling-chart-legend)
* [Styling the Plot Area](https://www.telerik.com/products/wpf/documentation/controls/radchart/styles-and-templates/styling-and-appearance-styling-plot-area)