# Creating a Chart Declaratively

In some situations you might want to create a chart declaratively - in XAML. This is useful when you have static data that will not change in time.

This tutorial will walk you through the common tasks of:

* [Adding RadChart and setting the DefaultView property](https://www.telerik.com/products/wpf/documentation/controls/radchart/populating-with-data/creating-chart-declaratively#adding-radchart-and-setting-the-defaultview-property)

* [Adding ChartTitle](https://www.telerik.com/products/wpf/documentation/controls/radchart/populating-with-data/creating-chart-declaratively#adding-charttitle)

* [Adding ChartLegend](https://www.telerik.com/products/wpf/documentation/controls/radchart/populating-with-data/creating-chart-declaratively#adding-chartlegend)

* [Adding ChartArea](https://www.telerik.com/products/wpf/documentation/controls/radchart/populating-with-data/creating-chart-declaratively#adding-chartarea)

* [Adding DataSeries](https://www.telerik.com/products/wpf/documentation/controls/radchart/populating-with-data/creating-chart-declaratively#adding-dataseries)

> In order to use **RadChart** control in your projects you have to add references to **Telerik.Windows.Controls.Charting.dll**.

## Adding RadChart and Setting the DefaultView Property

For most of the cases, where a chart has a title, a legend and a chart area, **RadChart** control provides you with a **DefaultView** that contains these three elements.

In your XAML file, add a new **RadChart** declaration and make a new instance of **ChartDefaultView** which has to be set to the **RadChart.DefaultView** property.

```XAML
	<telerik:RadChart>
	    <telerik:RadChart.DefaultView>
	        <telerik:ChartDefaultView />
	    </telerik:RadChart.DefaultView>
	</telerik:RadChart>
```

> To use **RadChart** in your XAML file, add a reference to the following namespaces: **xmlns:telerikChart="clr-namespace:Telerik.Windows.Controls;assembly=Telerik.Windows.Controls.Charting"** and   **xmlns:telerikCharting="clr-namespace:Telerik.Windows.Controls.Charting;assembly=Telerik.Windows.Controls.Charting"**

The **ChartDefaultView** contains [ChartTitle](https://www.telerik.com/products/wpf/documentation/controls/radchart/features/chart-title), [ChartLegend](https://www.telerik.com/products/wpf/documentation/controls/radchart/features/chart-legend) and [ChartArea](https://www.telerik.com/products/wpf/documentation/controls/radchart/features/chart-area) and you have to use them to build the chart in the way you need. The next several sections will show you how to set these properties.

## Adding ChartTitle

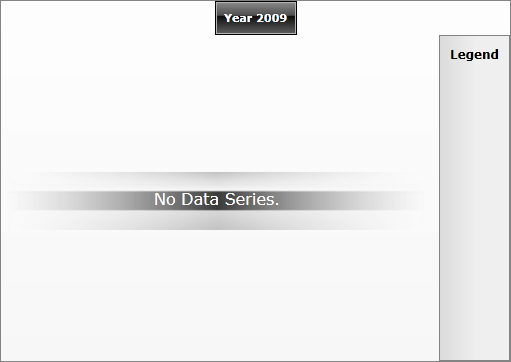
After declaring the default view, the next step is to add a chart title. Find your **RadChart** declaration and add chart title "Year 2009" which is positioned in the center:

```XAML
	<telerik:RadChart VerticalAlignment="Top">
	    <telerik:RadChart.DefaultView>
	        <telerik:ChartDefaultView>
	            <telerik:ChartDefaultView.ChartTitle>
	                <telerik:ChartTitle Content="Year 2009" HorizontalAlignment="Center"/>
	            </telerik:ChartDefaultView.ChartTitle>
	        </telerik:ChartDefaultView>
	    </telerik:RadChart.DefaultView>
	</telerik:RadChart>
```

```
 
```

![WPF RadChart  ](https://www.telerik.com/products/wpf/documentation/assets/fd00f8bb3cbcb72b2e2cab1ae5076904/radchart_populatingwithdata_creatingchartdeclaratively_010.png)

## Adding ChartLegend

Add a **ChartLegend** declaration to your default view declaration. If you want the data series which is added later in the **ChartArea** to be automatically added in the legend, set the **UseAutoGeneratedItems** property to **True**.

```XAML
	<telerik:RadChart VerticalAlignment="Top">
	    <telerik:RadChart.DefaultView>
	        <telerik:ChartDefaultView>
	
	            <telerik:ChartDefaultView.ChartTitle>
	                <telerik:ChartTitle Content="Year 2009" HorizontalAlignment="Center"/>
	            </telerik:ChartDefaultView.ChartTitle>
	
	            <telerik:ChartDefaultView.ChartLegend>
	                <telerik:ChartLegend x:Name="chartLegend" UseAutoGeneratedItems="True" />
	            </telerik:ChartDefaultView.ChartLegend>
	
	        </telerik:ChartDefaultView>
	    </telerik:RadChart.DefaultView>
	</telerik:RadChart>
```

## Adding ChartArea

The third step in the populating a **RadChart** with data is adding a **ChartArea**.

> Note that to show the **DataSeries** in the legend you have to also set the **ChartArea.LegendName** property with the name of the **ChartLegend** you want.

```XAML
	<telerik:RadChart VerticalAlignment="Top">
	    <telerik:RadChart.DefaultView>
	        <telerik:ChartDefaultView>
	            <telerik:ChartDefaultView.ChartTitle>
	                <telerik:ChartTitle Content="Year 2009" HorizontalAlignment="Center"/>
	            </telerik:ChartDefaultView.ChartTitle>
	            <telerik:ChartDefaultView.ChartLegend>
	                <telerik:ChartLegend x:Name="chartLegend" UseAutoGeneratedItems="True" />
	            </telerik:ChartDefaultView.ChartLegend>
	            <telerik:ChartDefaultView.ChartArea>
	                <telerik:ChartArea LegendName="chartLegend" />
	            </telerik:ChartDefaultView.ChartArea>
	        </telerik:ChartDefaultView>
	    </telerik:RadChart.DefaultView>
	</telerik:RadChart>
```

## Adding DataSeries

The **ChartArea** has a list of **DataSeries**, where you have to add one **DataSeries** per the chart graphic you want to see. The **DataSeries** has a property **Definition** of type **ISeriesDefinition** where the chart type has to be specified - **LineSeriesDefinition** for line chart, **BarSeriesDefinition** for bar chart, etc. The last thing you have to define is the data for each **DataSeries**: simply add as many **DataPoints** as you need - one for each point of the chart.

The **DataPoint** class represents a single piece of data that is visualized in a chart series. For each **DataPoint**, you can define several values depending on the chart type: **XValue** and **YValue**, **High** and **Low**, **Open** and **Close**, etc. These values are used later to visually calculate and draw the chart graphic.

Other properties of **DataPoint** are the **LegendLable** and the **LegendFormat.** The first one specifies the text displayed in the **ChartLegend** related to that **DataSeries,** while the second one defines the format of the labels.

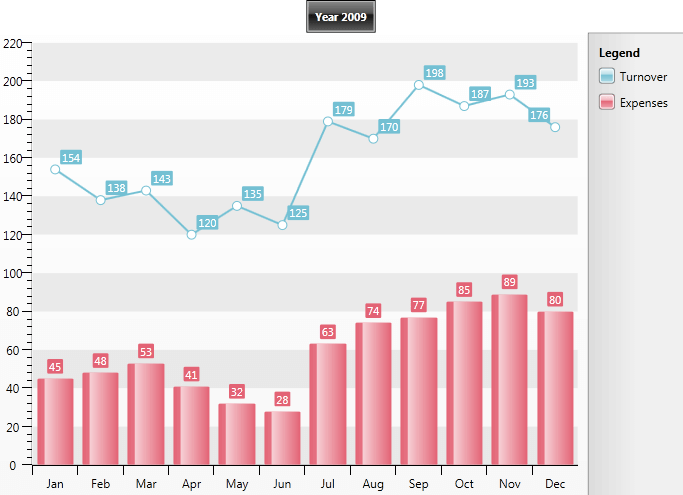
The XAML bellow defines **LineSeriesDefinition**, that represents the line chart showing the Turnover for year 2009. The data is defined as **DataPoints**, where **Y-Axis** (**YValue**) is set with the desired value. The second data series is **BarSeriesDefinition** for the Expenses defined in a similar way.

```XAML
	<telerik:RadChart VerticalAlignment="Top">
	    <telerik:RadChart.DefaultView>
	        <telerik:ChartDefaultView>
	
	            <telerik:ChartDefaultView.ChartTitle>
	                <telerik:ChartTitle Content="Year 2009" HorizontalAlignment="Center"/>
	            </telerik:ChartDefaultView.ChartTitle>
	
	            <telerik:ChartDefaultView.ChartLegend>
	                <telerik:ChartLegend x:Name="chartLegend" UseAutoGeneratedItems="True" />
	            </telerik:ChartDefaultView.ChartLegend>
	
	            <telerik:ChartDefaultView.ChartArea>
	                <telerik:ChartArea LegendName="chartLegend">
	                    <telerik:ChartArea.DataSeries>
	
	                        
	                        <telerik:DataSeries LegendLabel="Turnover">
	                            <telerik:DataSeries.Definition>
	                                <telerik:LineSeriesDefinition  />
	                            </telerik:DataSeries.Definition>
	                            <telerik:DataPoint YValue="154" XCategory="Jan"/>
	                            <telerik:DataPoint YValue="138" XCategory="Feb"/>
	                            <telerik:DataPoint YValue="143" XCategory="Mar"/>
	                            <telerik:DataPoint YValue="120" XCategory="Apr"/>
	                            <telerik:DataPoint YValue="135" XCategory="May"/>
	                            <telerik:DataPoint YValue="125" XCategory="Jun"/>
	                            <telerik:DataPoint YValue="179" XCategory="Jul"/>
	                            <telerik:DataPoint YValue="170" XCategory="Aug"/>
	                            <telerik:DataPoint YValue="198" XCategory="Sep"/>
	                            <telerik:DataPoint YValue="187" XCategory="Oct"/>
	                            <telerik:DataPoint YValue="193" XCategory="Nov"/>
	                            <telerik:DataPoint YValue="176" XCategory="Dec"/>
	                        </telerik:DataSeries>
	
	                        
	                        <telerik:DataSeries LegendLabel="Expenses">
	                            <telerik:DataSeries.Definition>
	                                <telerik:BarSeriesDefinition />
	                            </telerik:DataSeries.Definition>
	                            <telerik:DataPoint YValue="45" XCategory="Jan"/>
	                            <telerik:DataPoint YValue="48" XCategory="Feb"/>
	                            <telerik:DataPoint YValue="53" XCategory="Mar"/>
	                            <telerik:DataPoint YValue="41" XCategory="Apr"/>
	                            <telerik:DataPoint YValue="32" XCategory="May"/>
	                            <telerik:DataPoint YValue="28" XCategory="Jun"/>
	                            <telerik:DataPoint YValue="63" XCategory="Jul"/>
	                            <telerik:DataPoint YValue="74" XCategory="Aug"/>
	                            <telerik:DataPoint YValue="77" XCategory="Sep"/>
	                            <telerik:DataPoint YValue="85" XCategory="Oct"/>
	                            <telerik:DataPoint YValue="89" XCategory="Nov"/>
	                            <telerik:DataPoint YValue="80" XCategory="Dec"/>
	                        </telerik:DataSeries>
	                    </telerik:ChartArea.DataSeries>
	                </telerik:ChartArea>
	            </telerik:ChartDefaultView.ChartArea>
	        </telerik:ChartDefaultView>
	    </telerik:RadChart.DefaultView>
	</telerik:RadChart>
```

The result is [categorical chart](https://www.telerik.com/products/wpf/documentation/controls/radchart/features/categorical-charts), where on **X-Axis** you can see the months:
![WPF RadChart  ](https://www.telerik.com/products/wpf/documentation/assets/9ca908271bd18e06304d2568a2394063/radchart_populatingwithdata_creatingchartdeclaratively_020.png)

## See Also

* [Overview](https://www.telerik.com/products/wpf/documentation/controls/radchart/populating-with-data/overview)

* [Creating a Chart in Code-behind](https://www.telerik.com/products/wpf/documentation/controls/radchart/populating-with-data/creating-chart-in-code-behind)

* [Data Binding Support Overview](https://www.telerik.com/products/wpf/documentation/controls/radchart/populating-with-data/data-binding-support-overview)

* [Data Binding with Automatic Series Mappings](https://www.telerik.com/products/wpf/documentation/controls/radchart/populating-with-data/data-binding-with-automatic-series-binding)

* [Data Binding with Manual Series Mapping](https://www.telerik.com/products/wpf/documentation/controls/radchart/populating-with-data/data-binding-with-manual-series-mapping)