# MVVM Support
## Controlling Bar Colors with MVVM
The Telerik **RadChart** control can be used with great success with the **Model-View-ViewModel (MVVM)** pattern. This tutorial will demonstrate how to use the MVVM pattern to get a better control over the colors of the bars of a single series.
* Create a new class named **Person**, which implements the **INotifyPropertyChanged** interface.
```C#
public class Person : INotifyPropertyChanged
{
private double grade;
private string _name;
public string Name
{
get
{
return _name;
}
private set
{
_name = value;
}
}
public double Grade
{
get
{
return this.grade;
}
set
{
this.grade = value;
this.OnPropertyChanged( "Grade" );
}
}
public Person( string name, double grade )
{
Name = name;
Grade = grade;
}
public event PropertyChangedEventHandler PropertyChanged;
protected virtual void OnPropertyChanged( string propertyName )
{
if ( this.PropertyChanged != null )
this.PropertyChanged( this, new PropertyChangedEventArgs( propertyName ) );
}
}
```
```VB.NET
Public Class Person
Implements INotifyPropertyChanged
Private m_grade As Double
Private _name As String
Public Property Name() As String
Get
Return _name
End Get
Private Set(ByVal value As String)
_name = value
End Set
End Property
Public Property Grade() As Double
Get
Return Me.m_grade
End Get
Set(ByVal value As Double)
Me.m_grade = value
Me.OnPropertyChanged("Grade")
End Set
End Property
Public Sub New(ByVal name__1 As String, ByVal grade__2 As Double)
Name = name__1
Grade = grade__2
End Sub
Protected Overridable Sub OnPropertyChanged(ByVal propertyName As String)
RaiseEvent PropertyChanged(Me, New PropertyChangedEventArgs(propertyName))
End Sub
Public Event PropertyChanged(sender As Object, e As PropertyChangedEventArgs) Implements INotifyPropertyChanged.PropertyChanged
End Class
```
The class has two properties:
* **Name** - will be displayed on the X axis.
* **Grade** - will be displayed on the Y axis.
Create a new class named **PersonViewModel**, which implements the **INotifyPropertyChanged** interface. It will be used as an **ItemsSource** for the chart control.
```C#
public class PersonViewModel : INotifyPropertyChanged
{
private Person _person;
public Person Person
{
get
{
return _person;
}
private set
{
_person = value;
}
}
private Brush _gradeColor;
public Brush GradeColor
{
get
{
return _gradeColor;
}
private set
{
_gradeColor = value;
}
}
public PersonViewModel( Person person )
{
this.Person = person;
person.PropertyChanged += HandleStudentPropertyChanged;
this.UpdateGradeColor();
}
private void HandleStudentPropertyChanged( object sender, PropertyChangedEventArgs e )
{
if ( e.PropertyName == "Grade" )
this.UpdateGradeColor();
}
private void UpdateGradeColor()
{
if ( this.Person.Grade < 10 )
this.GradeColor = this.CreateBrush( "#FFFF3D40" );
else if ( this.Person.Grade < 20 )
this.GradeColor = this.CreateBrush( "#FFFD583A" );
else if ( this.Person.Grade < 30 )
this.GradeColor = this.CreateBrush( "#FFFD8145" );
else if ( this.Person.Grade < 40 )
this.GradeColor = this.CreateBrush( "#FFFAA03D" );
else if ( this.Person.Grade < 50 )
this.GradeColor = this.CreateBrush( "#FFFAC741" );
else if ( this.Person.Grade < 60 )
this.GradeColor = this.CreateBrush( "#FFFCED40" );
else if ( this.Person.Grade < 70 )
this.GradeColor = this.CreateBrush( "#FFD7FC3C" );
else if ( this.Person.Grade < 80 )
this.GradeColor = this.CreateBrush( "#FF99F839" );
else if ( this.Person.Grade < 90 )
this.GradeColor = this.CreateBrush( "#FF46E633" );
else
this.GradeColor = this.CreateBrush( "#FF1CD64D" );
this.OnPropertyChanged( "GradeColor" );
}
public event PropertyChangedEventHandler PropertyChanged;
protected virtual void OnPropertyChanged( string propertyName )
{
if ( this.PropertyChanged != null )
this.PropertyChanged( this, new PropertyChangedEventArgs( propertyName ) );
}
private Brush CreateBrush( string color )
{
return new SolidColorBrush( this.GetColorFromHexString( color ) );
}
private Color GetColorFromHexString( string s )
{
s = s.Replace( "#", string.Empty );
byte a = System.Convert.ToByte( s.Substring( 0, 2 ), 16 );
byte r = System.Convert.ToByte( s.Substring( 2, 2 ), 16 );
byte g = System.Convert.ToByte( s.Substring( 4, 2 ), 16 );
byte b = System.Convert.ToByte( s.Substring( 6, 2 ), 16 );
return Color.FromArgb( a, r, g, b );
}
}
```
```VB.NET
Public Class PersonViewModel
Implements INotifyPropertyChanged
Private _person As Person
Public Property Person() As Person
Get
Return _person
End Get
Private Set(ByVal value As Person)
_person = value
End Set
End Property
Private _gradeColor As Brush
Public Property GradeColor() As Brush
Get
Return _gradeColor
End Get
Private Set(ByVal value As Brush)
_gradeColor = value
End Set
End Property
Public Sub New(ByVal person As Person)
Me.Person = person
AddHandler person.PropertyChanged, AddressOf HandleStudentPropertyChanged
Me.UpdateGradeColor()
End Sub
Private Sub HandleStudentPropertyChanged(ByVal sender As Object, ByVal e As PropertyChangedEventArgs)
If e.PropertyName = "Grade" Then
Me.UpdateGradeColor()
End If
End Sub
Private Sub UpdateGradeColor()
If Me.Person.Grade < 10 Then
Me.GradeColor = Me.CreateBrush("#FFFF3D40")
ElseIf Me.Person.Grade < 20 Then
Me.GradeColor = Me.CreateBrush("#FFFD583A")
ElseIf Me.Person.Grade < 30 Then
Me.GradeColor = Me.CreateBrush("#FFFD8145")
ElseIf Me.Person.Grade < 40 Then
Me.GradeColor = Me.CreateBrush("#FFFAA03D")
ElseIf Me.Person.Grade < 50 Then
Me.GradeColor = Me.CreateBrush("#FFFAC741")
ElseIf Me.Person.Grade < 60 Then
Me.GradeColor = Me.CreateBrush("#FFFCED40")
ElseIf Me.Person.Grade < 70 Then
Me.GradeColor = Me.CreateBrush("#FFD7FC3C")
ElseIf Me.Person.Grade < 80 Then
Me.GradeColor = Me.CreateBrush("#FF99F839")
ElseIf Me.Person.Grade < 90 Then
Me.GradeColor = Me.CreateBrush("#FF46E633")
Else
Me.GradeColor = Me.CreateBrush("#FF1CD64D")
End If
Me.OnPropertyChanged("GradeColor")
End Sub
Protected Overridable Sub OnPropertyChanged(ByVal propertyName As String)
RaiseEvent PropertyChanged(Me, New PropertyChangedEventArgs(propertyName))
End Sub
Private Function CreateBrush(ByVal color As String) As Brush
Return New SolidColorBrush(Me.GetColorFromHexString(color))
End Function
Private Function GetColorFromHexString(ByVal s As String) As Color
s = s.Replace("#", String.Empty)
Dim a As Byte = System.Convert.ToByte(s.Substring(0, 2), 16)
Dim r As Byte = System.Convert.ToByte(s.Substring(2, 2), 16)
Dim g As Byte = System.Convert.ToByte(s.Substring(4, 2), 16)
Dim b As Byte = System.Convert.ToByte(s.Substring(6, 2), 16)
Return Color.FromArgb(a, r, g, b)
End Function
Public Event PropertyChanged(sender As Object, e As PropertyChangedEventArgs) Implements INotifyPropertyChanged.PropertyChanged
End Class
```
The class has two properties:
* A reference to a **Person** object.
* **GradeColor** - the corresponding color of the referenced person.
There are a few helper methods. The **UpdateGradeColor** method is used to return a specific color, based on the person **Grade** property.
* Add a new chart declaration to your XAML.
```XAML
```
* The chart will be built in the code-behind.
* A BarChart will be used.
* The **Grade** property will be displayed on the ordinate.
* The **Name** property will be displayed on the absciss.
```C#
private void MVVM_Loaded( object sender, RoutedEventArgs e )
{
radChart.DefaultView.ChartArea.AxisY.AutoRange = false;
radChart.DefaultView.ChartArea.AxisY.MinValue = 0;
radChart.DefaultView.ChartArea.AxisY.MaxValue = 100;
radChart.DefaultView.ChartArea.AxisY.Step = 10;
radChart.DefaultView.ChartLegend.Visibility = System.Windows.Visibility.Collapsed;
radChart.DefaultSeriesDefinition = new BarSeriesDefinition();
SeriesMapping seriesMapping = new SeriesMapping();
seriesMapping.ItemMappings.Add( new ItemMapping( "Person.Grade", DataPointMember.YValue ) );
seriesMapping.ItemMappings.Add( new ItemMapping( "Person.Name", DataPointMember.XCategory ) );
radChart.SeriesMappings.Add( seriesMapping );
radChart.ItemsSource = this.GetData();
}
```
```VB.NET
Private Sub MVVM_Loaded(ByVal sender As Object, ByVal e As RoutedEventArgs)
radChart.DefaultView.ChartArea.AxisY.AutoRange = False
radChart.DefaultView.ChartArea.AxisY.MinValue = 0
radChart.DefaultView.ChartArea.AxisY.MaxValue = 100
radChart.DefaultView.ChartArea.AxisY.[Step] = 10
radChart.DefaultView.ChartLegend.Visibility = System.Windows.Visibility.Collapsed
radChart.DefaultSeriesDefinition = New BarSeriesDefinition()
Dim seriesMapping As New SeriesMapping()
seriesMapping.ItemMappings.Add(New ItemMapping("Person.Grade", DataPointMember.YValue))
seriesMapping.ItemMappings.Add(New ItemMapping("Person.Name", DataPointMember.XCategory))
radChart.SeriesMappings.Add(seriesMapping)
radChart.ItemsSource = Me.GetData()
End Sub
```
Here is the code for the **GetData()** method, which creates the mockup data:
```C#
private List GetData()
{
Random rand = new Random( DateTime.Now.Millisecond );
List studentList = new List();
for ( int i = 0; i < rand.Next( 9, 12 ); i++ )
studentList.Add( new Person( "Person" + i, rand.Next( 15, 100 ) ) );
List modelList = new List();
foreach ( Person person in studentList )
modelList.Add( new PersonViewModel( person ) );
return modelList;
}
```
```VB.NET
Private Function GetData() As List(Of PersonViewModel)
Dim rand As Random = New Random(DateTime.Now.Millisecond)
Dim studentList As List(Of Person) = New List(Of Person)
Dim i As Integer = 0
Do While (i < rand.Next(9, 12))
studentList.Add(New Person(("Person" + i), rand.Next(15, 100)))
i = (i + 1)
Loop
Dim modelList As List(Of PersonViewModel) = New List(Of PersonViewModel)
For Each person As Person In studentList
modelList.Add(New PersonViewModel(person))
Next
Return modelList
End Function
```
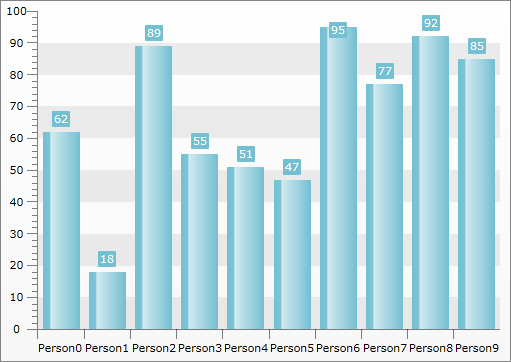
The result so far can be seen on the image below:
* The final step is to bind the **GradeColor** property of the **PersonViewModel** business object to the background of a single bar.
In order to change the background of each bar from the chart, you need to use the **CreateItemStyleDelegate** property of the **RadChart**. For more information read [here](https://www.telerik.com/products/wpf/documentation/controls/radchart/styles-and-templates/styling-and-appearance-custom-item-style).
Here is the method that will be passed to the delegate.
```C#
public Style BuildCustomItemStyle( Control item, Style style, DataPoint point, DataSeries dataSeries )
{
if ( ( item as BaseChartItem ) == null )
{
return style;
}
Style newStyle = new Style();
newStyle.BasedOn = style;
newStyle.TargetType = typeof( Shape );
Brush brush = ( dataSeries[ ( item as BaseChartItem ).CurrentIndex ].DataItem as PersonViewModel ).GradeColor;
newStyle.Setters.Add( new Setter( Shape.FillProperty, brush ) );
return newStyle;
}
```
```VB.NET
Public Function BuildCustomItemStyle(item As Control, style As Style, point As DataPoint, dataSeries As DataSeries) As Style
If TryCast(item, BaseChartItem) Is Nothing Then
Return style
End If
Dim newStyle As New Style()
newStyle.BasedOn = style
newStyle.TargetType = GetType(Shape)
Dim brush As Brush = TryCast(dataSeries(TryCast(item, BaseChartItem).CurrentIndex).DataItem, PersonViewModel).GradeColor
newStyle.Setters.Add(New Setter(Shape.FillProperty, brush))
Return newStyle
End Function
```
To pass this method to the **RadChart** use its **CustomItemStyleDelegate** property.
```C#
this.radChart.CreateItemStyleDelegate = this.BuildCustomItemStyle;
```
```VB.NET
Me.radChart.CreateItemStyleDelegate = Me.BuildCustomItemStyle
```
Set this property into the **MVVM_Loaded** handler.
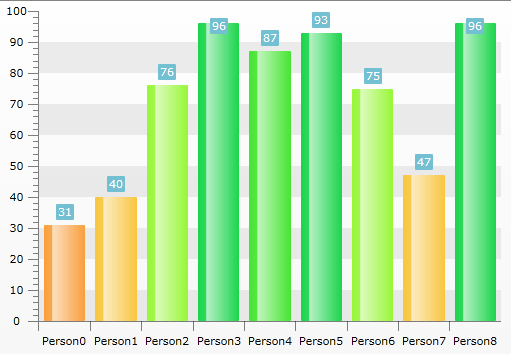
Here is the final result:
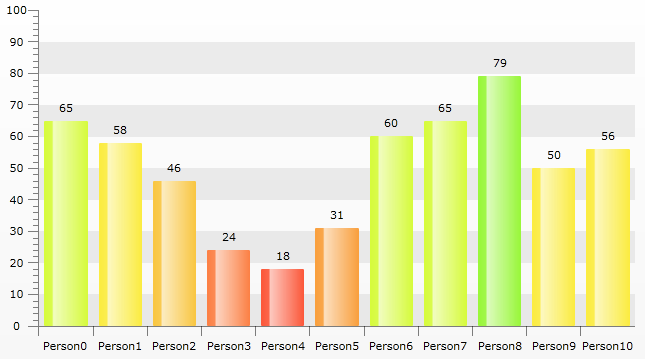
Additionally you may want to remove the Background from the SeriesItemsLabels. This can be achieved by retemplating the default Style so that the Background applied to the Labels is Transparent and setting the Foreground to Black for example:
```XAML
```
Don't forget to apply the Style to the SeriesItemLabelStyle property of the Series Definition:
```C#
radChart.DefaultSeriesDefinition.SeriesItemLabelStyle = this.Resources["MySeriesItemLabel_Style"] as Style;
```
```VB.NET
radChart.DefaultSeriesDefinition.SeriesItemLabelStyle = TryCast(Me.Resources("MySeriesItemLabel_Style"), Style)
```
The result:
## See Also
* [Drill Down Chart](https://www.telerik.com/products/wpf/documentation/controls/radchart/how-to/drill-down-chart)
* [Integration with RadGridView](https://www.telerik.com/products/wpf/documentation/controls/radchart/how-to/integration-with-rad-grid-view)