# Integration with RadGridView
The Telerik **RadChart** supports great integration with other controls. This tutorial will show you how to integrate **RadChart** with **RadGridView**.
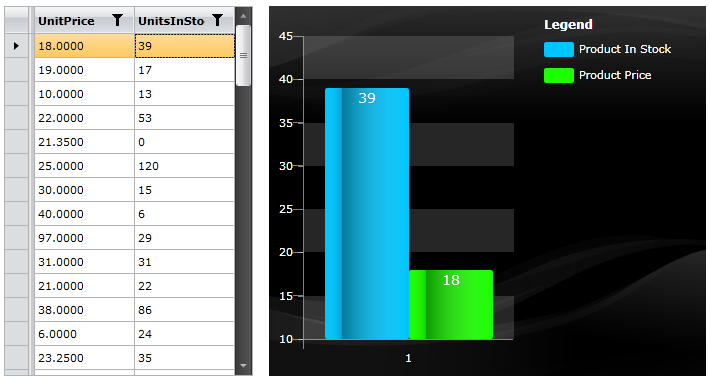
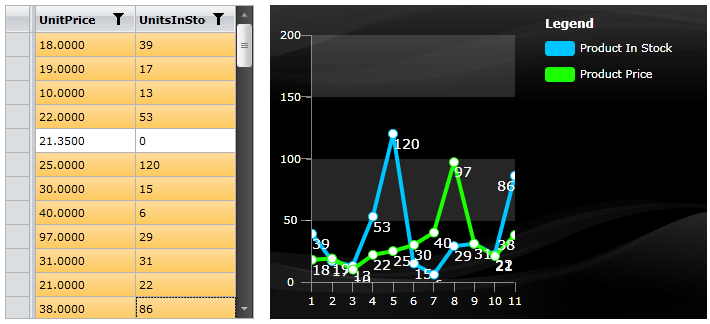
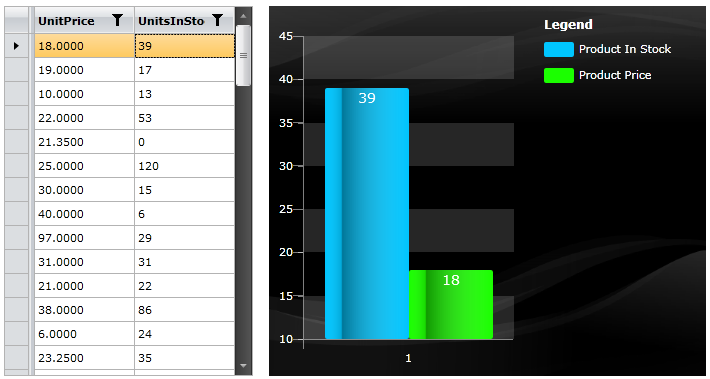
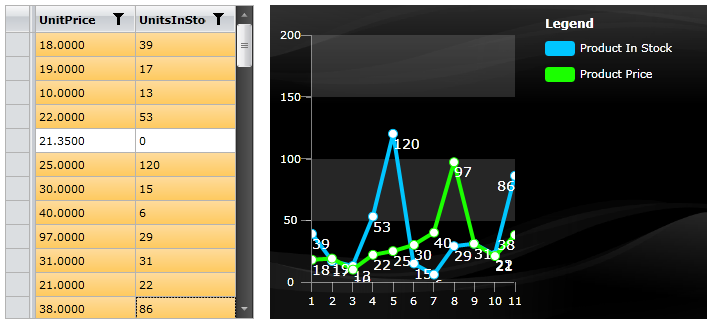
The final result should look like the snapshots below:
> This tutorial will use the **Northwind** database, which can be downloaded from [here](http://www.microsoft.com/downloads/details.aspx?FamilyID=06616212-0356-46A0-8DA2-EEBC53A68034\&displaylang=en).
* Here is the initial staging:
```XAML
```
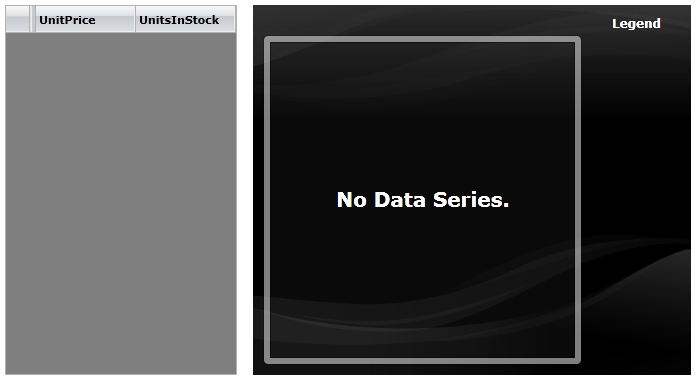
On the left side you have a **RadGridView**, where the **UnitPrice** and **UnitsInStock** properties from the Products table in the Northwind database will be displayed. When you select a single row, a bar chart will be generated to compare both of the parameters. If you select several rows, then a line chart will be generated.
* Populate the **RadGridView** control with all products from the Northwind database. Here is a sample code how to do that:
```C#
public class NorthwindDataSource
{
private static NorthwindEntities northwindEntity;
public NorthwindDataSource()
{
northwindEntity = new NorthwindEntities( new Uri( "http://localhost:52981/Services/SampleAdoNetDataService.svc/" ) );
this.Products = new ObservableCollection();
var query = from p in northwindEntity.Products
select p;
DataServiceQuery products = ( DataServiceQuery )query;
products.BeginExecute(
(IAsyncResult result) => EntitiesLoaded( result, this.Products ), products );
}
public ObservableCollection Products
{
get;
set;
}
private static void EntitiesLoaded(IAsyncResult result, Collection entities )
{
DataServiceQuery query = result.AsyncState as DataServiceQuery;
foreach ( T entity in query.EndExecute( result ) )
{
entities.Add( entity );
}
}
}
```
```C#
public class NorthwindDataSource
{
private static NorthwindEntities northwindEntity;
public NorthwindDataSource()
{
northwindEntity = new NorthwindEntities( new Uri( "http://localhost:52981/Services/SampleAdoNetDataService.svc/" ) );
this.Products = new ObservableCollection();
foreach ( Products p in northwindEntity.Products.Execute() )
{
this.Products.Add( p );
}
}
public ObservableCollection Products
{
get;
set;
}
}
```
```VB.NET
Public Class NorthwindDataSource
Private Shared northwindEntity As NorthwindEntities
Public Sub New()
northwindEntity = New NorthwindEntities(New Uri("http://localhost:52981/Services/SampleAdoNetDataService.svc/"))
Me.Products = New ObservableCollection(Of Products)()
Dim query = From p In northwindEntity.Products _
Select p
Dim products As DataServiceQuery(Of Products) = DirectCast(query, DataServiceQuery(Of Products))
products.BeginExecute(Sub(result As IAsyncResult) EntitiesLoaded(Of Products)(result, Me.Products), products)
End Sub
Private _Products As ObservableCollection(Of Products)
Public Property Products() As ObservableCollection(Of Products)
Get
Return _Products
End Get
Set(ByVal value As ObservableCollection(Of Products))
_Products = value
End Set
End Property
Private Shared Sub EntitiesLoaded(Of T)(ByVal result As IAsyncResult, ByVal entities As Collection(Of T))
Dim query As DataServiceQuery(Of T) = TryCast(result.AsyncState, DataServiceQuery(Of T))
For Each entity As T In query.EndExecute(result)
entities.Add(entity)
Next
End Sub
End Class
```
```VB.NET
Public Class NorthwindDataSource
Private Shared northwindEntity As NorthwindEntities
Public Sub New()
northwindEntity = New NorthwindEntities(New Uri("http://localhost:52981/Services/SampleAdoNetDataService.svc/"))
Me.Products = New ObservableCollection(Of Products)()
For Each p As Products In northwindEntity.Products.Execute()
Me.Products.Add(p)
Next
End Sub
Private _Products As ObservableCollection(Of Products)
Public Property Products() As ObservableCollection(Of Products)
Get
Return _Products
End Get
Set(ByVal value As ObservableCollection(Of Products))
_Products = value
End Set
End Property
End Class
```
Declare the **NorthwindDataSource** class as a resource in your application and set it as an **ItemsSource** for the gridview.
```XAML
```
```XAML
```
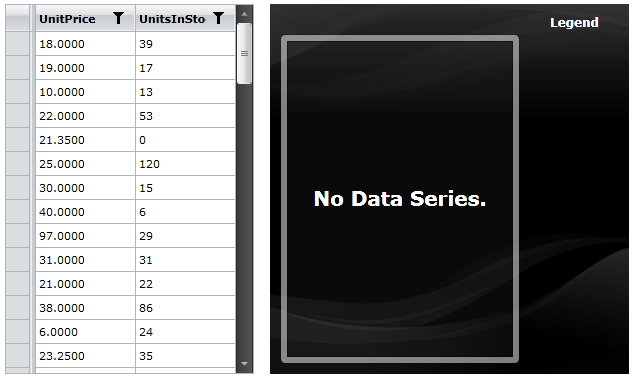
Here is the result so far:
* The next step is to build the bar chart (comparing the **UnitPrice** and **UnitsInStock** parameters) depending on the selected row(s) in the gridview.
* Attach to the **SelectionChanged** event of the **RadGridView**.
```XAML
```
* Switch to the code-behind and add the following code in the event handler. It aims to get all the selected products and to build the chart.
```C#
private void radGridView_SelectionChanged(object sender, SelectionChangeEventArgs e)
{
Collection selectedList = new Collection();
// Get all selected Items
foreach (Products product in radGridView.SelectedItems)
{
selectedList.Add(product);
}
CreateSeriesMappings(selectedList);
SetChartItemsSource(selectedList);
}
```
```VB.NET
Private Sub radGridView_SelectionChanged(ByVal sender As Object, ByVal e As SelectionChangeEventArgs)
Dim selectedList As New Collection(Of Products)()
' Get all selected Items '
For Each product As Products In radGridView.SelectedItems
selectedList.Add(product)
Next
CreateSeriesMappings(selectedList)
SetChartItemsSource(selectedList)
End Sub
```
* Here is the code for the **CreateSeriesMapping** method. It builds the **RadChart** control based on the selected products. If there is only one product that is selected, then the result will be a **BarChart** comparing the **UnitPrice** and the **UnitsInStock** parameters. If there are two or more products that are selected, then the result will be a **LineChart**.
```C#
private void CreateSeriesMappings( Collection invoicesList )
{
radChart.SeriesMappings.Clear();
SeriesMapping seriesMapping = new SeriesMapping();
seriesMapping.SeriesDefinition = invoicesList.Count < 2 ? ( ISeriesDefinition )new BarSeriesDefinition() : ( ISeriesDefinition )new LineSeriesDefinition();
seriesMapping.LegendLabel = "Product In Stock";
ItemMapping itemMapping = new ItemMapping();
itemMapping.DataPointMember = DataPointMember.YValue;
itemMapping.FieldName = "UnitsInStock";
seriesMapping.ItemMappings.Add( itemMapping );
SeriesMapping seriesMapping1 = new SeriesMapping();
seriesMapping1.SeriesDefinition = invoicesList.Count < 2 ? ( ISeriesDefinition )new BarSeriesDefinition() : ( ISeriesDefinition )new LineSeriesDefinition();
seriesMapping1.LegendLabel = "Product Price";
ItemMapping itemMapping1 = new ItemMapping();
itemMapping1.DataPointMember = DataPointMember.YValue;
itemMapping1.FieldName = "UnitPrice";
seriesMapping1.ItemMappings.Add( itemMapping1 );
radChart.SeriesMappings.Add( seriesMapping );
radChart.SeriesMappings.Add( seriesMapping1 );
}
```
```VB.NET
Private Sub CreateSeriesMappings(ByVal invoicesList As Collection(Of Products))
radChart.SeriesMappings.Clear()
Dim seriesMapping As New SeriesMapping()
seriesMapping.SeriesDefinition = If(invoicesList.Count < 2, DirectCast(New BarSeriesDefinition(), ISeriesDefinition), DirectCast(New LineSeriesDefinition(), ISeriesDefinition))
seriesMapping.LegendLabel = "Product In Stock"
Dim itemMapping As New ItemMapping()
itemMapping.DataPointMember = DataPointMember.YValue
itemMapping.FieldName = "UnitsInStock"
seriesMapping.ItemMappings.Add(itemMapping)
Dim seriesMapping1 As New SeriesMapping()
seriesMapping1.SeriesDefinition = If(invoicesList.Count < 2, DirectCast(New BarSeriesDefinition(), ISeriesDefinition), DirectCast(New LineSeriesDefinition(), ISeriesDefinition))
seriesMapping1.LegendLabel = "Product Price"
Dim itemMapping1 As New ItemMapping()
itemMapping1.DataPointMember = DataPointMember.YValue
itemMapping1.FieldName = "UnitPrice"
seriesMapping1.ItemMappings.Add(itemMapping1)
radChart.SeriesMappings.Add(seriesMapping)
radChart.SeriesMappings.Add(seriesMapping1)
End Sub
```
* The **SetChartItemsSource** method does only one thing - it sets the **ItemsSource** of the chart.
```C#
private void SetChartItemsSource( Collection invoicesList )
{
radChart.ItemsSource = invoicesList;
}
```
```VB.NET
Private Sub SetChartItemsSource(ByVal invoicesList As Collection(Of Products))
radChart.ItemsSource = invoicesList
End Sub
```
Here is the final result, when you select single row from the grid view:
And when you select multiple rows:
## See Also
* [Drill Down Chart](https://www.telerik.com/products/wpf/documentation/controls/radchart/how-to/drill-down-chart)
* [MVVM Support](https://www.telerik.com/products/wpf/documentation/controls/radchart/how-to/mvvm-support)