# Custom Line
The **Custom Line** annotation allows you to place a straight line at a specific place in your **Chart Area**. In order to place the **Custom Line** you have to add a **CustomLine** object to the **Annotations** collection of the **ChartArea**. You also have to use its__Slope and YIntercept__properties.
> tip You can place more than one **CustomLine** in your **ChartArea**.
In order to define the line you have to set the **Slope** and/or the **YIntercept** properties. The function which draws the custom line is **y = mx + b**, where '**m**' is the **Slope** and '**b**' is **YIntercept**.
The **Slope** is defined as the ratio of the rise of the line (i.e. how much the line rises vertically) to the run of line (i.e. how much the line runs horizontally).
The point(s) where the graph of a function intersects with the *y*-axis are called the **Y**
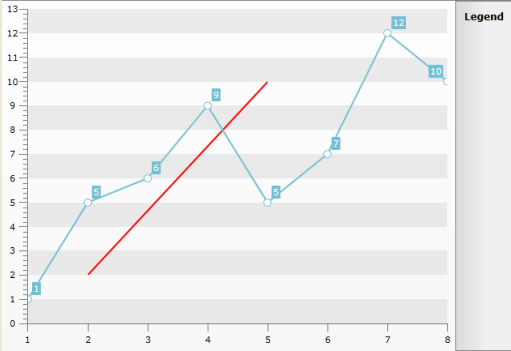
For example, if you want to have a line defined by these two points **(2,2)**, **(5,10)** you have to solve a system of two linear equations:
* **2 = m\*2 + b**
* **10 = m\*5 + b**
After solving it you will get the following values **2.66** for the **Slope** (m) and **-3.32** for the **YIntercept** (b). If you set these to the respective properties of the **CustomLine**, you will see the desired line appear.
> Note that this line will cross the entire **ChartArea**. If you want only a specific part of it to appear, you have to define the **clipping points** by setting the **MinX**, **MinY**, **MaxX**, \_\_MaxY__properties of the **CustomLine**. Their values should represent values somewhere on the respective axis.
```XAML
```
```C#
CustomLine customLine = new CustomLine();
customLine.Slope = 2.66;
customLine.YIntercept = -3.32;
customLine.MinX = 2;
customLine.MinY = 2;
customLine.MaxX = 5;
customLine.MaxY = 10;
customLine.Stroke = new SolidColorBrush(Colors.Red);
customLine.StrokeThickness = 2;
this.radChart.DefaultView.ChartArea.Annotations.Add(customLine);
```
```VB.NET
Dim _customLine As New CustomLine()
_customLine.Slope = 2.66
_customLine.YIntercept = -3.32
_customLine.MinX = 2
_customLine.MinY = 2
_customLine.MaxX = 5
_customLine.MaxY = 10
_customLine.Stroke = New SolidColorBrush(Colors.Red)
_customLine.StrokeThickness = 2
Me.radChart.DefaultView.ChartArea.Annotations.Add(_customLine)
```
Here is a snapshot of the final result.
## How to draw a Custom Line Parallel to one of the Axes
To make your custom line parallel to one of the two Axes you should set the *Slope* to **Infinity** and specify the *MinY* and *MaxY* properties in order to get it clipped properly. For example the following code snippet will draw a custom line parallel to the YAxis which intercepts the XAxis in X = 2:
```XAML
```
The result can be seen below:

> When the Custom Line should be parallel to the XAxis, its Slope should be set to **0**