# Custom Gridline
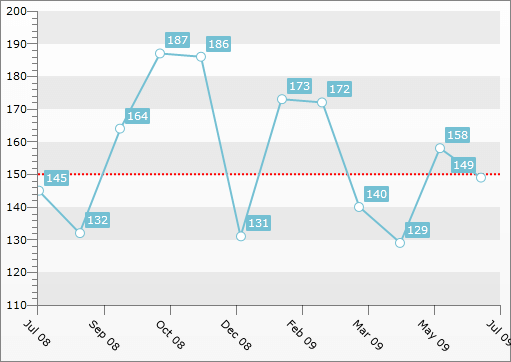
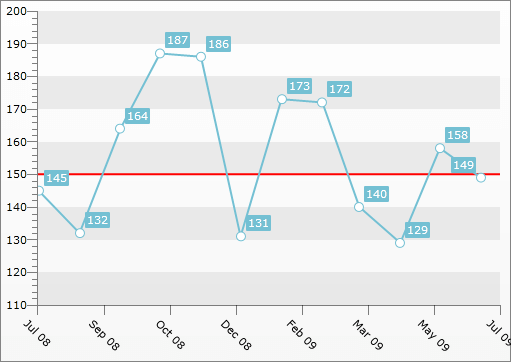
The Custom Gridline allows you to place a vertical or horizontal gridline at a specific place in your **ChartArea**. This allows you to mark a specific value on the **Y-Axis** and/or the **X-Axis**, which can, for example, serve as a border value. In order to place the Custom GridLine you have to add a **CustomGridLine** object to the **Annotations** collection of the **ChartArea**. You also have to set either its **XIntercept** or **YIntercept** properties. These properties allow you to specify the value of the X- and Y-Axis, for which the gridline should be placed.
> tip You can place more than one **CustomGridLine** in your **ChartArea**.
> The **XIntercept** and the **YIntercept** are of type **double**. Therefore, if the respective axis displays **DateTime** values, you have to pass converted to OLE Automation dates to them. For more information see [DateTime.ToOADate()](http://msdn.microsoft.com/en-us/library/system.datetime.tooadate\(VS.95\).aspx).
In order to customize the appearance of the **CustomGridLine** you can simply set its **Stroke** (will change its color) and its **StrokeThickness** (will change the thickness of the line).
> tip If you have multiple y-axes, you can specify to which the **CustomGridLine** should be applied by setting the **x:Name** value of the appropriate **Y-Axis** to the **YAxisName** property of the **CustomGridLine**.
Here is an example:
```XAML
```
```C#
CustomGridLine gridline = new CustomGridLine();
gridline.YIntercept = 150;
gridline.Stroke = new SolidColorBrush(Colors.Red);
gridline.StrokeThickness = 2;
this.radChart.DefaultView.ChartArea.Annotations.Add(gridline);
```
```VB.NET
Dim gridline As New CustomGridLine()
gridline.YIntercept = 150
gridline.Stroke = New SolidColorBrush(Colors.Red)
gridline.StrokeThickness = 2
Me.radChart.DefaultView.ChartArea.Annotations.Add(gridline)
```
Additional customizations can be done via the **ElementStyle** property. It gets applied to the **Line** element that visually represents the **CustomGridLine**. Via this style you can set the **StrokeDashArray** property for example.
```XAML
```
> tip This can be done in code behind too.
>