# Bubble Layer
This article shows how to use, configure and data bind the **Bubble** layer type of the Telerik Map control for ASP.NET AJAX.
The **Bubble** layer type is available since the **Q3 2014** release.
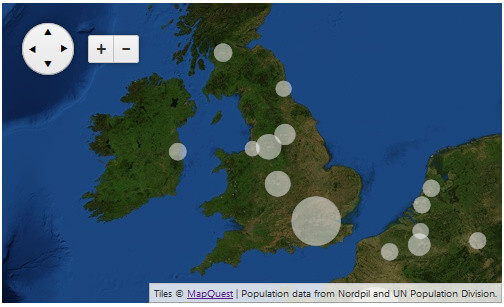
> caption **Figure 1**: Simple RadMap with a Bubble layer, which is a result of the code in Example 1.
Quick navigation:
1. [Overview](https://www.telerik.com/products/aspnet-ajax/documentation/controls/map/functionality/bubble-layer#overview)
2. [Client-side Data Binding](https://www.telerik.com/products/aspnet-ajax/documentation/controls/map/functionality/bubble-layer#client-side-data-binding)
3. [Custom Stylization](https://www.telerik.com/products/aspnet-ajax/documentation/controls/map/functionality/bubble-layer#custom-stylization)
4. [Using Client-side Events and Bubble Shapes](https://www.telerik.com/products/aspnet-ajax/documentation/controls/map/functionality/bubble-layer#using-client-side-events-and-bubble-shapes)
## Overview
The **Bubble** type of layer lets you create circular shapes on a geographic position with a radius that is calculated via the value associated with the shape.
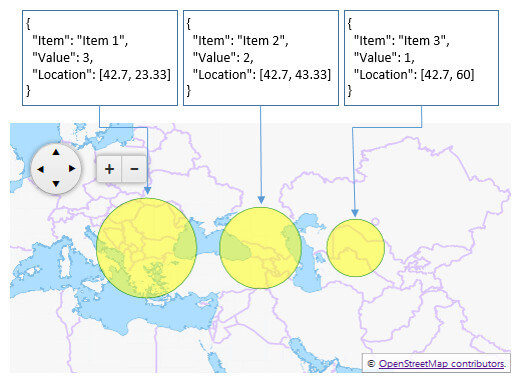
The **radiuses of the bubbles** are automatically calculated by the map control, based on the maximum and minimum values available in the data source. **Example 2** demonstrates how simple values reflect on the radius of the circular shapes.
Just like the [Shape layer](https://www.telerik.com/products/aspnet-ajax/documentation/controls/map/functionality/shapes), populating bubbles/shapes is done only via [client-side data binding](https://www.telerik.com/products/aspnet-ajax/documentation/controls/map/functionality/bubble-layer#client-side-data-binding). The data source fields that represent the location and the value of the shapes can be defined via the **LocationField** and **ValueField** properties of the **MapLayer** item. **Example 1** shows a basic data binding configuration by using the **RadClientDataSource** control.
Optionally, the bubbles can also be styled by using the **StyleSettings** inner tag. You can find more about this in the [Custom Stylization](https://www.telerik.com/products/aspnet-ajax/documentation/controls/map/functionality/bubble-layer#custom-stylization) section.
User interaction, data source relations and dynamic modifications can be achieved via the [Client-side Events](https://www.telerik.com/products/aspnet-ajax/documentation/controls/map/functionality/bubble-layer#using-client-side-events-and-bubble-shapes) of the **RadMap** control and their exposed event arguments.
## Client-side Data Binding
Adding shapes in the **Bubble** layer can be done only by binding it to a client-side data source.
The **Bubble** layer can be easily integrated with the **RadClientDataSource** control and bound to a **.json** file that contains the JSON literal—the data source. To do this, set the **ClientDataSourceID** property of the **MapLayer** item to the RadClientDataSource control’s **ID**.
In **Example 1**, the *urban-areas.json* file is the one that contains the data and defines the shapes on the **Bubble** layer. You can download the file from the [Bubble Layer](https://demos.telerik.com/aspnet-ajax/map/examples/functionality/bubble-layer/defaultcs.aspx) demo and examine the structure of the JSON literal. **Figure 1** is a result of the markup from **Example 1**.
> caption **Example 1**: Data binding a Bubble layer to a RadClientDataSource.
```ASP.NET
```
The data source items should contain two important fields: location and value (**Example 2**).
* **location** field—it should be a geographical position represented by a JavaScript array with the latitude and longitude values.
* **value** field—it depends on the purpose of the data that should be displayed, the value’s weight is the magnitude used to calculate the radius of each circle shape.
> caption **Example 2**: JSON literal of a simple, valid data item.
```JavaScript
{
"Location": [42.7, 60.0],
"Value": 543
}
```
**Figure 2** is the result of the simple data binding scenario from **Example 3**. You can see how the *"Value"* field set to the **ValueField** property of the **Bubble** layer affects the radius of the circle shapes.
> caption **Figure 2**: Value and circle radius dependency in the bubble shapes.
> caption **Example 3**: Simple data binding of a Bubble layer
```ASP.NET
```
## Custom Stylization
By default, the bubbles on the **Bubble** layer are colorized according to the set [Skin](https://www.telerik.com/products/aspnet-ajax/documentation/controls/map/appearance-and-styling/skins).Optionally, you can change their appearance according to your design requirements.
To do so, you can use the **FillSettings** and **StrokeSettings** tags exposed in the **StyleSettings** of the used **MapLayer**. More details about the available attributes and how to configure them are available in the [Kendo Map online documentation](https://docs.telerik.com/kendo-ui/api/javascript/dataviz/ui/map#configuration-layerDefaults.shape.style).
Simple markup demonstration of a custom shape stylization with the described settings is provided in **Example 3** and you can see the result in **Figure 2**.
## Using Client-side Events and Bubble Shapes
You can dynamically alter the look and behavior of the **Bubble** layer or implement some user-interaction capabilities by using the [client-side events of the RadMap control](https://www.telerik.com/products/aspnet-ajax/documentation/controls/map/client-side-programming) and changing the [style attributes of the shape](https://docs.telerik.com/kendo-ui/api/javascript/dataviz/ui/map#configuration-layerDefaults.bubble.style) according to your logic (**Example 4**).
> tip To manipulate the bubbles you should use the **Shape** related events, i.e.,[OnShapeCreated](https://docs.telerik.com/kendo-ui/api/javascript/dataviz/ui/map#events-shapeCreated), [OnShapeClick](https://docs.telerik.com/kendo-ui/api/javascript/dataviz/ui/map#events-shapeClick), [OnShapeMouseEnter](https://docs.telerik.com/kendo-ui/api/javascript/dataviz/ui/map#events-shapeMouseEnter) and [OnShapeMouseLeave](https://docs.telerik.com/kendo-ui/api/javascript/dataviz/ui/map#events-shapeMouseLeave).
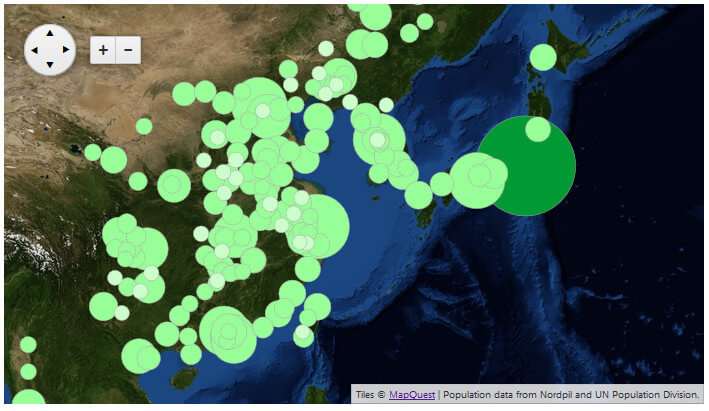
In **Example 3**, you can see how the **OnShapeCreated** event is used to alter the fill-color of the bubbles based on the value of the shape objects. **Figure 3** shows the rendered map as a result of the custom implementation.
> caption **Figure 3**: Changing bubbles’ fill-color based on custom logic.
> caption **Example 4**: Using the OnShapeCreated event to dynamically change the shapes of a Bubble layer.
```ASP.NET
```
## See Also
* [Overview](https://www.telerik.com/products/aspnet-ajax/documentation/controls/map/getting-started/overview)
* [Shapes](https://www.telerik.com/products/aspnet-ajax/documentation/controls/map/functionality/shapes)
* [Client-side Programming](https://www.telerik.com/products/aspnet-ajax/documentation/controls/map/client-side-programming)
* [Client-side](https://www.telerik.com/products/aspnet-ajax/documentation/controls/map/data-binding/client-side)
* [Kendo Map API Reference](https://docs.telerik.com/kendo-ui/api/javascript/dataviz/ui/map)
* [Live Demo: Bubble Layer](https://demos.telerik.com/aspnet-ajax/map/examples/functionality/bubble-layer/defaultcs.aspx)