# Display HTML and Execute JavaScript
## Overview
You can display HTML in the [ASP.NET AJAX Chart](https://www.telerik.com/products/aspnet-ajax/html-chart.aspx), by using tooltips and/or execute JavaScript (i.e., declare variables,if statements, for loops, etc.) in **ClientTemplate** and SharedTemplate elements. You can find more information on these features in the sections below - *Execute JavaScript with a ClientTemplate* and *Display HTML with a ClientTemplate*.
## Execute JavaScript with a ClientTemplate
ClientTemplates let you use JavaScript, following this pattern: `"#if (condition) {# expression #}#"`.
* **If Statement**:
```ASP.NET
#if (percentage > 0.15) {# #=value# #} else {# 0 #} #
#if (percentage > 0.15) {# #=value# #} else {# 0 #} #
```
Only PieSeries/DonutSeries items whose percentage of the whole is higher than 15% will display their actual value in tooltips and labels. The rest of the series items will display a zero value.
* **For Loop**:
```ASP.NET
GDP in #= category #
# for (var i = 0; i < points.length; i++) { #
#: points[i].series.name#: #: points[i].value #
# } #
```
The tooltip will display three lines of text. The first line shows the category and the next two lines show the Y-values of both items from this category.
* **Call a function**
```ASP.NET
#= formatLabel(value) #
```
## Display HTML with a ClientTemplate
ClientTemplate can render HTML from a data source following this syntax: `"#: #"`. **Figure 1** shows an example of using a ClientTemplate to render HTML in a tooltip.
> caption Example 1: This example illustrates how to render and display HTML in tooltips.
```ASP.NET
HTML is displayed: #:dataItem.myHTMLColumn#
HTML is not displayed: #=dataItem.myHTMLColumn#
```
```C#
protected void Page_Load(object sender, EventArgs e)
{
if (!IsPostBack)
{
RadHtmlChart1.DataSource = GetData();
RadHtmlChart1.DataBind();
}
}
protected DataTable GetData()
{
DataTable tbl = new DataTable();
tbl.Columns.Add(new DataColumn("myDataColumn"));
tbl.Columns.Add(new DataColumn("myLabelsColumn"));
tbl.Columns.Add(new DataColumn("myHTMLColumn"));
tbl.Rows.Add(new object[] { 1, "item aaa", "lorem ipsum 1" });
tbl.Rows.Add(new object[] { 2, "item bbb", "lorem ipsum 2" });
tbl.Rows.Add(new object[] { 3, "item ccc", "lorem ipsum 3" });
return tbl;
}
```
```VB
Protected Sub Page_Load(sender As Object, e As EventArgs) Handles Me.Load
If Not IsPostBack Then
RadHtmlChart1.DataSource = GetData()
RadHtmlChart1.DataBind()
End If
End Sub
Protected Function GetData() As DataTable
Dim tbl As New DataTable()
tbl.Columns.Add(New DataColumn("myDataColumn"))
tbl.Columns.Add(New DataColumn("myLabelsColumn"))
tbl.Columns.Add(New DataColumn("myHTMLColumn"))
tbl.Rows.Add(New Object() {1, "item aaa", "lorem ipsum 1"})
tbl.Rows.Add(New Object() {2, "item bbb", "lorem ipsum 2"})
tbl.Rows.Add(New Object() {3, "item ccc", "lorem ipsum 3"})
Return tbl
End Function
```
> caption Figure 1: Using a ClientTemplate to display HTML in a tooltip.
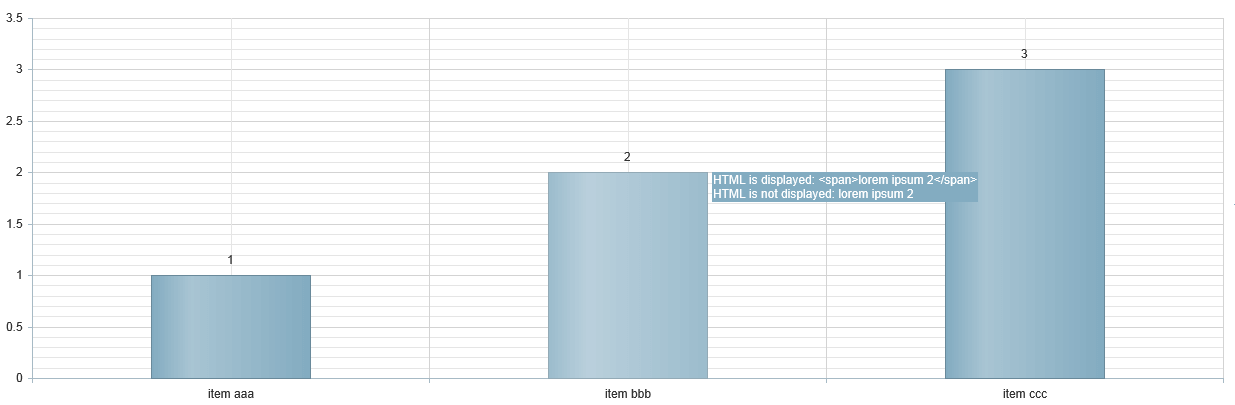
> important Since tooltips are rendered as pure HTML and labels as part of the SVG/VML rendering, HTML can only be rendered inside tooltips.
> note You can use number formats inside **Client Templates** . You can find more information in [this Formatting Numbers](https://www.telerik.com/products/aspnet-ajax/documentation/controls/htmlchart/appearance-and-styling/format-numbers) article in the section called *Formatting Labels and Tooltips by Using their Client Templates.*
## See Also
* [Overview](https://www.telerik.com/products/aspnet-ajax/documentation/controls/htmlchart/functionality/clienttemplate/overview)
* [Shared Template for ToolTips](https://www.telerik.com/products/aspnet-ajax/documentation/controls/htmlchart/functionality/clienttemplate/shared-template-for-tooltips)
* [Format Numbers](https://www.telerik.com/products/aspnet-ajax/documentation/controls/htmlchart/appearance-and-styling/format-numbers)