# Logarithmic Axis
This help article explains how to use a logarithmic axis in the [ASP.NET AJAX Chart](https://www.telerik.com/products/aspnet-ajax/html-chart.aspx) control. The feature is available since Q3 2014.
A logarithmic axis is a special numeric axis that transforms the actual values by using a logarithmic function with a particular base. The purpose of the logarithmic axis is to display values that cover different orders of magnitude in a more convenient way because it lets large values display together with small values in a more condensed scale than the default linear axis.
In order to configure a logarithmic axis in **RadHtmlChart** you must set the **Type** property of the **Axis** to "**Log**". You can control the base of the logarithm via the **Step** property (default value is 10).
> warning Logarithmic scale can be used only for numerical data, so it cannot be used for a category or date axis. This means that the x-axis of anArea, Line, Bar and Column series cannot be put in logarithmic mode.
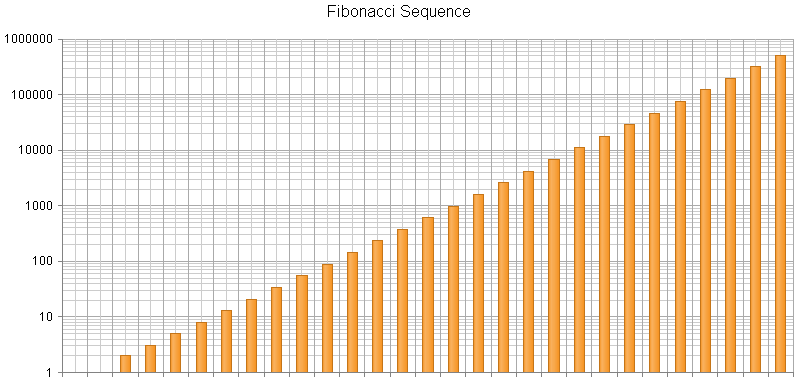
**Example 1** shows how to configure a logarithmic y-axis in **RadHtmlChart** and **Figure 1** displays the output.
> caption Example 1: Configuring a logarithmic y-axis in a Column series that displays a Fibonacci sequence.
```ASP.NET
```
```C#
protected void Page_Load(object sender, EventArgs e)
{
if (!IsPostBack)
{
RadHtmlChart1.DataSource = GetFibonacciSequence(29);
RadHtmlChart1.DataBind();
}
}
protected List GetFibonacciSequence(int n)
{
List data = new List() { 1, 1 };
for (int i = 2; i < n; i++)
{
data.Add(data[i - 2] + data[i - 1]);
}
return data;
}
```
```VB
Protected Sub Page_Load(sender As Object, e As EventArgs) Handles Me.Load
If Not IsPostBack Then
RadHtmlChart1.DataSource = GetFibonacciSequence(29)
RadHtmlChart1.DataBind()
End If
End Sub
Protected Function GetFibonacciSequence(n As Integer) As List(Of Integer)
Dim data As New List(Of Integer)() From {1, 1}
For i As Integer = 2 To n - 1
data.Add(data(i - 2) + data(i - 1))
Next
Return data
End Function
```
> caption Figure 1: Column series with a logarithmic y-axis.
## See Also
* [Configuring PlotArea Element Axes of the RadHtmlChart](https://www.telerik.com/products/aspnet-ajax/documentation/controls/htmlchart/server-side-programming/axes-configuration)