# Legend Settings
This help article discusses how to configure the [ASP.NET AJAX Chart](https://www.telerik.com/products/aspnet-ajax/html-chart.aspx) legend.
* [Appearance](https://www.telerik.com/products/aspnet-ajax/documentation/controls/htmlchart/appearance-and-styling/legend-settings#appearance)
* [Position and Alignment](https://www.telerik.com/products/aspnet-ajax/documentation/controls/htmlchart/appearance-and-styling/legend-settings#position-and-alignment)
* [Orientation](https://www.telerik.com/products/aspnet-ajax/documentation/controls/htmlchart/appearance-and-styling/legend-settings#orientation)
* [Client Templates](https://www.telerik.com/products/aspnet-ajax/documentation/controls/htmlchart/appearance-and-styling/legend-settings#client-templates)
* [Visual Templates](https://www.telerik.com/products/aspnet-ajax/documentation/controls/htmlchart/functionality/visual-template)
* [Troubleshooting (*Legend is not visible*)](https://www.telerik.com/products/aspnet-ajax/documentation/controls/htmlchart/troubleshooting/common-issues#legend-is-not-visible)
## Appearance
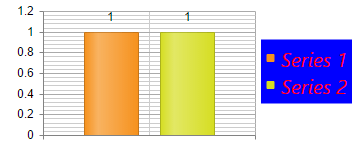
You can control the background color of the legend with the `Legend.Appearance.BackgroundColor` property. To control the color and the font of the text you can use the `Legend.Appearance.TextStyle` inner property (**Example 1**).
You can find all the available options for the `TextStyle` inner property in the [Labels and Titles Font Settings](https://www.telerik.com/products/aspnet-ajax/documentation/controls/htmlchart/appearance-and-styling/labels-and-titles-font-settings) help article.
> caption **Figure 1**: Chart legend with customized background and text styles.
> caption **Example 1**: Configure the appearance of the chart legend.
```ASP.NET
```
```C#
protected void Page_Init(object sender, EventArgs e)
{
int seriesNum = 2;
for (int i = 1; i <= seriesNum; i++)
{
ColumnSeries cs1 = new ColumnSeries() { Name = "Series " + i };
cs1.SeriesItems.Add(new CategorySeriesItem() { Y = 1 });
RadHtmlChart1.PlotArea.Series.Add(cs1);
}
}
```
```VB
Protected Sub Page_Init(sender As Object, e As EventArgs)
Dim seriesNum As Integer = 2
For i As Integer = 1 To seriesNum
Dim cs1 As New ColumnSeries() With { _
Key .Name = "Series " & i _
}
cs1.SeriesItems.Add(New CategorySeriesItem() With { _
Key .Y = 1 _
})
RadHtmlChart1.PlotArea.Series.Add(cs1)
Next
End Sub
```
The color of the markers is automatically detected from the series colors.
### Legend Marker Shapes
To customize the Legend items' marker size and type, you have a few options:
1. Use [visual templates](https://www.telerik.com/products/aspnet-ajax/documentation/controls/htmlchart/functionality/visual-template) as demonstrated in the **Example 2**
2. Use the overwrite shared in the [Automatic Legend marker shape customization](https://www.telerik.com/products/aspnet-ajax/documentation/knowledge-base/htmlchart-custom-legend-marker-shape) KB article.
> caption **Figure 2**: Legend shape customized via `VisualTemplate`.

> caption **Example 2**: The code that creates **Figure 2**.
```ASP.NET
```
## Position and Alignment
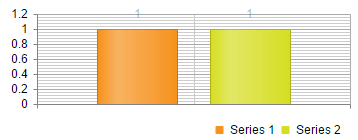
You can control the position and the alignment of the legend with the following properties exposed by the `Legend.Appearance` tag:
* `Position` - The position of the chart, relative to the plot area (**Example 3**). The supported values are:
* `Top` - The legend is positioned on the top of the chart area.
* `Bottom` - The legend is positioned on the bottom of the chart area.
* `Left` - The legend is positioned on the left of the chart area.
* `Right` - The legend is positioned on the right of the chart area.
* `Custom` - The legend can be positioned on a custom position through the `OffsetX` and `OffsetY` properties.
* `Align` - The alignment of the legend, relative to the position (**Example 3**). When the legend is `Top` or `Bottom` positioned it can be horizontally aligned. When the legend is `Left` or `Right` positioned in can be vertically aligned. The supported values are:
* `Start` - The legend is left or top aligned according to its position.
* `End` - The legend is right or bottom aligned according to its position.
* `Center` - The legend is centered according to its position.
* `OffsetX` - The x offset of the legend. The x value is relative to the current position of the legend. A positive and negative value can be set.
* `OffsetY` - The y offset of the legend. The y value is relative to the current position of the legend. A positive and negative value can be set.
> caption **Figure 3**: Legend with `Position`=`Bottom` and `Align`=`End`.
> caption **Example 3**: The code that creates **Figure 3**.
```ASP.NET
```
```C#
protected void Page_Init(object sender, EventArgs e)
{
int seriesNum = 2;
for (int i = 1; i <= seriesNum; i++)
{
ColumnSeries cs1 = new ColumnSeries() { Name = "Series " + i };
cs1.SeriesItems.Add(new CategorySeriesItem() { Y = 1 });
RadHtmlChart1.PlotArea.Series.Add(cs1);
}
}
```
```VB
Protected Sub Page_Init(sender As Object, e As EventArgs)
Dim seriesNum As Integer = 2
For i As Integer = 1 To seriesNum
Dim cs1 As New ColumnSeries() With { _
Key .Name = "Series " & i _
}
cs1.SeriesItems.Add(New CategorySeriesItem() With { _
Key .Y = 1 _
})
RadHtmlChart1.PlotArea.Series.Add(cs1)
Next
End Sub
```
## Orientation
The `Legend.Appearance.Orientation` property lets you distribute the legend items vertically or horizontally. You can also define distribution constraints by setting particular dimensions for the legend via the `Legend.Appearance.Width` and `Legend.Appearance.Height` properties.
* `Orientation` - The orientation of the legend items.
* `Horizontal` - Legend items are added horizontally.
* `Vertical` - Legend items are added vertically.
* `Width` - The legend width when the legend orientation is set to `Horizontal`.
* `Height` - The legend height when the legend orientation is set to `Vertical`.
You can see the difference of both orientations with different legend dimensions in **Figure 4** and **Figure 4**.
> caption **Figure 4**: Compare the legend of two charts with horizontal orientation and different width.

> caption **Example 4**: The code that creates **Figure 4**.
```ASP.NET
```
```C#
protected void Page_Init(object sender, EventArgs e)
{
int seriesNum = 10;
for (int i = 1; i <= seriesNum; i++)
{
ColumnSeries cs1 = new ColumnSeries() { Name = "Series " + i };
RadHtmlChart1.PlotArea.Series.Add(cs1);
RadHtmlChart2.PlotArea.Series.Add(cs1);
}
}
```
```VB
Protected Sub Page_Init(sender As Object, e As EventArgs)
Dim seriesNum As Integer = 10
For i As Integer = 1 To seriesNum
Dim cs1 As New ColumnSeries() With { _
Key .Name = "Series " & i _
}
RadHtmlChart1.PlotArea.Series.Add(cs1)
RadHtmlChart2.PlotArea.Series.Add(cs1)
Next
End Sub
```
> caption **Figure 5**: Compare the legend of two charts with vertical orientation and different height.

> caption **Example 5**: The code that creates **Figure 5**.
```ASP.NET
```
```C#
protected void Page_Init(object sender, EventArgs e)
{
int seriesNum = 10;
for (int i = 1; i <= seriesNum; i++)
{
ColumnSeries cs1 = new ColumnSeries() { Name = "Series " + i };
RadHtmlChart1.PlotArea.Series.Add(cs1);
RadHtmlChart2.PlotArea.Series.Add(cs1);
}
}
```
```VB
Protected Sub Page_Init(sender As Object, e As EventArgs)
Dim seriesNum As Integer = 10
For i As Integer = 1 To seriesNum
Dim cs1 As New ColumnSeries() With { _
Key .Name = "Series " & i _
}
RadHtmlChart1.PlotArea.Series.Add(cs1)
RadHtmlChart2.PlotArea.Series.Add(cs1)
Next
End Sub
```
## Client Templates
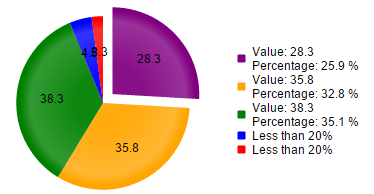
You can use client-side templates to display custom text in the legend labels since the **Q2 2016** release.
The functionality is available through the `ClientTemplate` inner property exposed by the `Legend.Appearance` tag. The fields that can be used inside the template are available in the [legend.labels.template](https://docs.telerik.com/kendo-ui/api/javascript/dataviz/ui/chart#configuration-legend.labels.template) article.
> tip You can also execute JavaScript in the `ClientTemplate`. More information is available in the [Execute JavaScript with a ClientTemplate](https://www.telerik.com/products/aspnet-ajax/documentation/controls/htmlchart/functionality/clienttemplate/display-html-and-execute-javascript) article.
> caption **Figure 6**: You can define client templates for the legend labels.
> caption **Example 6**: Configure a sample client template for the legend.
```ASP.NET
```
To keep a legend item on one line, do not include `\n` in the `ClientTemplate`. A comma in formatted text, such as `10,500`, does not create a line break. The following example uses the documented `text` field and sets a width for a horizontal legend:
```ASP.NET
```
The `dataItem` fields used by series labels and tooltips are not documented as fields for a legend `ClientTemplate`. If the legend text is longer than the available space, adjust `Legend.Appearance.Width`, `Height`, `Position`, or `Orientation` instead of adding a line-feed sequence.
## See Also
* [Labels and Titles Font Settings](https://www.telerik.com/products/aspnet-ajax/documentation/controls/htmlchart/appearance-and-styling/labels-and-titles-font-settings)
* [Visual Templates](https://www.telerik.com/products/aspnet-ajax/documentation/controls/htmlchart/functionality/visual-template)
* [ADD more legend markers options in RadHtmlChart](https://feedback.telerik.com/Project/108/Feedback/Details/123802)
* [legend.labels.template](https://docs.telerik.com/kendo-ui/api/javascript/dataviz/ui/chart#configuration-legend.labels.template)
* [Execute JavaScript with a ClientTemplate](https://www.telerik.com/products/aspnet-ajax/documentation/controls/htmlchart/functionality/clienttemplate/display-html-and-execute-javascript)