# .NET MAUI DataGrid SkiaSharp Cell Renderer
When your [.NET MAUI DataGrid](https://www.telerik.com/maui-ui/documentation/controls/datagrid/overview) is rendered with the SkiaSharp library, you can extend the functionality of a DataGrid column and render custom cell content.
* `CellRenderer`(`DataGridCellRenderer`)—Defines a renderer that allows custom rendering of cells when the DataGrid is rendered with SkiaSharp. To use this in iOS and MacCatalyst, the `RadDataGrid`.`RenderMode` needs to be set to `SkiaSharp`.
> Check the [Render Mode](https://www.telerik.com/maui-ui/documentation/controls/datagrid/render-mode) topic for more information on the DataGrid SkiaSharp rendering.
The `DataGridCellRenderer` provides the following methods you can override to define any custom SkiaSharp content inside each cell:
* `MeasureContainer`—Returns the desired size for the current item in device independent pixels.
* `RenderContainer`—Renders any custom content for the current item. Invoke the base implementation of this method if you want to render the default render content.
* `RequestRender`—Makes a request for a render pass to be scheduled.
* `OnRenderStarted`—Marks the beginning of the rendering of the cells related to this renderer.
* `OnRenderCompleted`—Marks the end of the rendering of the cells related to this renderer.
## Example
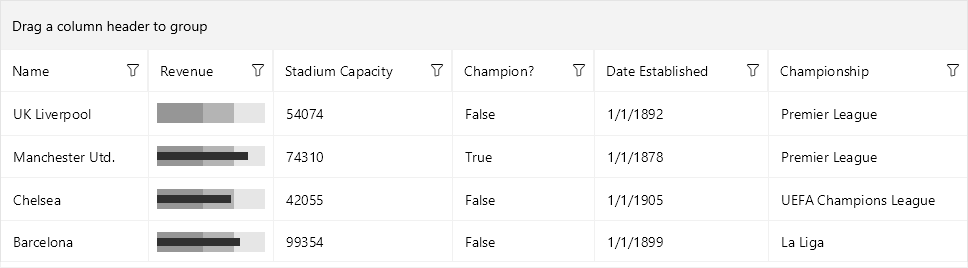
Check below an example on how to add a `BulletGraph` control as the content of a DataGrid `TextColumn`.
**1.** Add a sample DataGrid definition which presents information about `Club` objects. The `TextColumn` corresponding to the `Revenue` property uses a custom `CellRenderer` which renders a SkiaSharp bullet graph.
```XAML
```
**2.** Add the custom `CellRenderer` to the page's resources:
```XAML
```
**3.** Here is the `CustomColumnRenderer` class which inherits from `DataGridCellRenderer` and overrides its `RenderContainer` method:
```C#
public class CustomColumnRenderer : DataGridCellRenderer
{
protected override void RenderContainer(DataGridCellRendererRenderContext renderContext)
{
Club club = (Club)renderContext.Item;
if (renderContext is DataGridSkiaSharpCellRendererRenderContext skRenderContext)
{
this.DrawBulletGraph(club.Revenue, skRenderContext, skRenderContext.Bounds);
}
}
private void DrawBulletGraph(double? revenue, DataGridSkiaSharpCellRendererRenderContext skRenderContext, Rect bounds)
{
double badRange = 300;
double satisfactoryRange = 500;
double goodRange = 700;
double horizontalPadding = 8;
double bulletGraphWidth = bounds.Width - 2 * horizontalPadding;
double x = bounds.X + horizontalPadding;
double h = 20;
double y = bounds.Y + (bounds.Height - h) / 2;
double featuredHeight = 8;
double displayScale = skRenderContext.DisplayScale;
// bad range
using (SKPaint paint = new SKPaint())
{
paint.Color = new SKColor(150, 150, 150);
Rect rect = new Rect(x, y, bulletGraphWidth * (badRange / goodRange), h);
skRenderContext.Canvas.DrawRect(SkiaUtils.ToSKRect(rect, displayScale), paint);
x += rect.Width;
}
// satisfactory range
using (SKPaint paint = new SKPaint())
{
paint.Color = new SKColor(180, 180, 180);
Rect rect = new Rect(x, y, bulletGraphWidth * ((satisfactoryRange - badRange) / goodRange), h);
skRenderContext.Canvas.DrawRect(SkiaUtils.ToSKRect(rect, displayScale), paint);
x += rect.Width;
}
// good range
using (SKPaint paint = new SKPaint())
{
paint.Color = new SKColor(230, 230, 230);
Rect rect = new Rect(x, y, bulletGraphWidth * ((goodRange - satisfactoryRange) / goodRange), h);
skRenderContext.Canvas.DrawRect(SkiaUtils.ToSKRect(rect, displayScale), paint);
}
// featured measure
if (revenue != null)
{
using (SKPaint paint = new SKPaint())
{
paint.Color = new SKColor(48, 48, 48);
Rect rect = new Rect(bounds.X + horizontalPadding, y + ((h - featuredHeight) / 2), bulletGraphWidth * (revenue.Value / goodRange), featuredHeight);
skRenderContext.Canvas.DrawRect(SkiaUtils.ToSKRect(rect, displayScale), paint);
}
}
}
internal static class SkiaUtils
{
public static SKRect ToSKRect(Rect rect, double scale = 1)
{
return new SKRect((float)(scale * rect.Left), (float)(scale * rect.Top), (float)(scale * rect.Right), (float)(scale * rect.Bottom));
}
public static Rect ToRect(SKRect skRect, double scale = 1)
{
return new Rect(scale * skRect.Left, scale * skRect.Top, scale * skRect.Right, scale * skRect.Bottom);
}
}
}
```
**4.** Add the `ViewModel` class:
```C#
public class ViewModel
{
private ObservableCollection clubs;
public ObservableCollection Clubs => clubs ?? (clubs = CreateClubs());
private ObservableCollection CreateClubs()
{
return new ObservableCollection
{
new Club("UK Liverpool", new DateTime(1892, 1, 1), 54074, "England", "Liverpool", "Premier League", null),
new Club("Manchester Utd.", new DateTime(1878, 1, 1), 74310, "England", "Manchester", "Premier League", 594.3) { IsChampion = true },
new Club("Chelsea", new DateTime(1905, 1, 1), 42055, "England", "London","UEFA Champions League", 481.3),
new Club("Barcelona", new DateTime(1899, 1, 1), 99354, "Spain", "Barcelona", "La Liga", 540.5)
};
}
}
```
**5.** Add the `Club` data object:
```C#
public class Club : NotifyPropertyChangedBase
{
private string name;
private DateTime established;
private int stadiumCapacity;
private bool isChampion;
private string country;
private string city;
private string championship;
private double? revenue;
public Club(string name, DateTime established, int stadiumCapacity, string country, string city, string championship, double? revenue)
{
Name = name;
Established = established;
StadiumCapacity = stadiumCapacity;
Country = country;
City = city;
Championship = championship;
Revenue = revenue;
}
public string Name
{
get { return this.name; }
set { this.UpdateValue(ref this.name, value); }
}
public DateTime Established
{
get { return this.established; }
set { this.UpdateValue(ref this.established, value); }
}
public int StadiumCapacity
{
get { return this.stadiumCapacity; }
set { this.UpdateValue(ref this.stadiumCapacity, value); }
}
public bool IsChampion
{
get { return this.isChampion; }
set { this.UpdateValue(ref this.isChampion, value); }
}
public string Country
{
get { return this.country; }
set { this.UpdateValue(ref this.country, value); }
}
public string City
{
get { return this.city; }
set { this.UpdateValue(ref this.city, value); }
}
public string Championship
{
get { return this.championship; }
set { this.UpdateValue(ref this.championship, value); }
}
public double? Revenue
{
get { return this.revenue; }
set { this.UpdateValue(ref this.revenue, value); }
}
public List Championships => new List { "UEFA Champions League", "Premier League", "La Liga" };
public List Countries => new List { "England", "Spain" };
}
```
**6.** The last step is to set the `ViewModel` class as a binding context of the page:
```C#
this.BindingContext = new ViewModel();
```
Here is the result:
## See Also
* [Render Mode](https://www.telerik.com/maui-ui/documentation/controls/datagrid/render-mode)
* [SkiaSharp GitHub](https://github.com/mono/SkiaSharp?#skiasharp)
* [SkiaSharp SKCanvas](https://learn.microsoft.com/en-us/dotnet/api/skiasharp.skcanvas)