# .NET MAUI Cartesian Chart OHLC Series
The `OhlcSeries` visualizes financial data, such as stock prices, as Open-High-Low-Close (OHLC) bars.
The OHLC Series operates with a special data in the form of four parameters defining the stock market—**open**, **high**, **low**, and **close**.
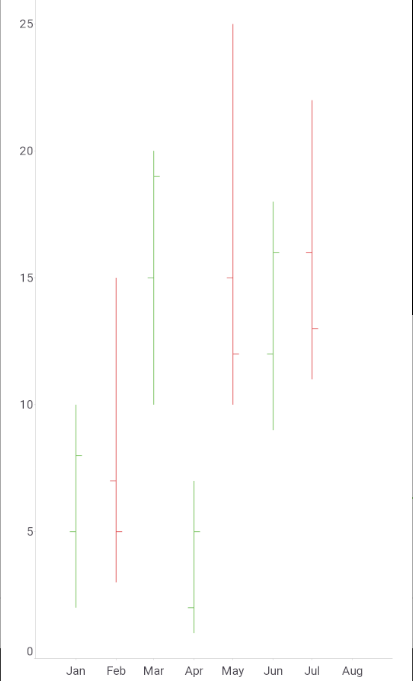
Each data point renders as a vertical line that spans the high and low prices for a period. A left tick marks the opening price and a right tick marks the closing price.
Use the `OhlcSeries` when you need to show price movement over time in a compact form. For a filled-body alternative, use the [Candlestick Series](https://www.telerik.com/maui-ui/documentation/controls/charts/cartesian-chart/series/candlestick-series).
## Bind the OHLC Series to Data
The `OhlcSeries` reads four price values and one category value from each data item. Use the following properties to bind the series:
* `ItemsSource` (`IEnumerable`)—Defines the collection of data items that the series plots.
* `HorizontalBinding` (`string`)—Defines the name of the data-item member that provides the category, for example, a date, plotted along the horizontal axis.
* `OpenBinding` (`string`)—Defines the name of the data-item member that provides the opening price.
* `HighBinding` (`string`)—Defines the name of the data-item member that provides the highest price.
* `LowBinding` (`string`)—Defines the name of the data-item member that provides the lowest price.
* `CloseBinding` (`string`)—Defines the name of the data-item member that provides the closing price.
* `HorizontalAxis` (`Telerik.Maui.Controls.Charts.ChartAxis`)—Defines the horizontal axis against which the series plots the category values.
* `VerticalAxis` (`Telerik.Maui.Controls.Charts.ChartAxis`)—Defines the vertical axis against which the series plots the price values.
## Customize the OHLC Bars
The `OhlcSeries` colors each data point according to its price direction. A data point is bullish when the closing price is higher than the opening price, and bearish otherwise. Use the following properties to customize the bars:
* `BullishStroke` (`Brush`)—Defines the stroke of bullish data points.
* `BearishStroke` (`Brush`)—Defines the stroke of bearish data points.
* `StrokeThickness` (`double`)—Defines the thickness of the lines in device-independent units. The default value is `double.NaN`, which applies the default thickness of the chart.
> note The `BullishStroke` and `BearishStroke` properties support only `SolidColorBrush` values. When a brush is `null`, the series resolves it from the explicit style, the implicit style, and the theme defaults, in that order.
## Example with OHLC Series
The following example shows how to define an `OhlcSeries` with a `DateTimeAxis` and a `NumericalAxis`.
1. Define the `OhlcSeries` and the chart definition in Extensible Application Markup Language (XAML):
```XAML
```
2. Add the `charts` namespace:
```XAML
xmlns:charts="clr-namespace:Telerik.Maui.Controls.Charts;assembly=Telerik.Maui.Controls"
```
3. Add the data model that exposes the `Category`, `Open`, `High`, `Low`, and `Close` properties:
```C#
public class OhlcDataPoint : NotifyPropertyChangedBase
{
private DateTime category;
private double open;
private double high;
private double low;
private double close;
public DateTime Category
{
get { return this.category; }
set
{
if (value != this.category)
{
this.category = value;
this.OnPropertyChanged();
}
}
}
public double Open
{
get { return this.open; }
set
{
if (value != this.open)
{
this.open = value;
this.OnPropertyChanged();
}
}
}
public double High
{
get { return this.high; }
set
{
if (value != this.high)
{
this.high = value;
this.OnPropertyChanged();
}
}
}
public double Low
{
get { return this.low; }
set
{
if (value != this.low)
{
this.low = value;
this.OnPropertyChanged();
}
}
}
public double Close
{
get { return this.close; }
set
{
if (value != this.close)
{
this.close = value;
this.OnPropertyChanged();
}
}
}
}
```
4. Add the `ViewModel` that populates the data collection:
```C#
public class FinancialViewModel
{
public FinancialViewModel()
{
this.Data = new ObservableCollection
{
new OhlcDataPoint { Category = new DateTime(2024, 1, 1), Open = 5, High = 10, Low = 2, Close = 8 },
new OhlcDataPoint { Category = new DateTime(2024, 2, 1), Open = 7, High = 15, Low = 3, Close = 5 },
new OhlcDataPoint { Category = new DateTime(2024, 3, 1), Open = 15, High = 20, Low = 10, Close = 19 },
new OhlcDataPoint { Category = new DateTime(2024, 4, 1), Open = 2, High = 7, Low = 1, Close = 5 },
new OhlcDataPoint { Category = new DateTime(2024, 5, 1), Open = 15, High = 25, Low = 10, Close = 12 },
new OhlcDataPoint { Category = new DateTime(2024, 6, 1), Open = 12, High = 18, Low = 9, Close = 16 },
new OhlcDataPoint { Category = new DateTime(2024, 7, 1), Open = 16, High = 22, Low = 11, Close = 13 },
};
}
public ObservableCollection Data { get; }
}
```
The following image shows the result, with monthly OHLC bars from January to July:
> tip For a runnable example with the Cartesian Chart OHLC series, go to the [SDKBrowser Demo Application](https://www.telerik.com/maui-ui/documentation/demos-and-sample-apps/sdkbrowser-app) and navigate to the **Charts > Series** category.
## Known Limitations
The `OhlcSeries` does not support data point labels.
## See Also
* [Candlestick Series](https://www.telerik.com/maui-ui/documentation/controls/charts/cartesian-chart/series/candlestick-series)
* [Bar Series](https://www.telerik.com/maui-ui/documentation/controls/charts/cartesian-chart/series/bar-series)
* [Line Series](https://www.telerik.com/maui-ui/documentation/controls/charts/cartesian-chart/series/line-series)