# .NET MAUI Cartesian Chart Annotations
Annotations are visual elements that mark specific values or ranges in the plot area of the Cartesian Chart. Use annotations to highlight a target value, a threshold, an acceptable range, or a period of interest. Annotations don't depend on the series data, so they stay in place when the data changes.
To add annotations, populate the `Annotations` collection of the `RadCartesianChart`. Each annotation must reference an axis that belongs to the same chart, and an annotation instance can't belong to another chart.
## Annotation Types
The Cartesian Chart supports the following annotation types:
| Annotation | Description |
| ------------------------------------ | -------------------------------------------------------------------------------------------------------------- |
| `ChartGridLineAnnotation` | Draws a line across the plot area at an exact axis value or category position. |
| `ChartPlotBandAnnotation` | Draws a band between two exact axis positions. |
| `ChartCategoricalPlotBandAnnotation` | Draws a band over a range of categories and includes the complete slots of the endpoint categories by default. |
## Configure Common Annotation Properties
All annotations share properties that control their visibility and rendering order. Use the following properties to configure any annotation:
* `IsVisible` (`bool`)—Defines whether the annotation is drawn. The default value is `true`.
* `Opacity` (`double`)—Defines the opacity of the annotation, from `0` to `1`. The value multiplies the alpha channel of the brushes. The default value is `1`.
* `Layer` (`enum` of type `Telerik.Maui.Controls.Charts.ChartAnnotationLayer`)—Defines whether the annotation renders below or above the series. The available options are:
* `BelowSeries`—Draws the annotation below the grid and the series. This is the default value for plot bands.
* `AboveSeries`—Draws the annotation above the series and below the axes. This is the default value for grid lines.
* `ZIndex` (`int`)—Defines the drawing order within the layer. Annotations with equal values keep their order in the collection.
* `Style` (`Style`)—Defines a style that merges with the implicit and theme styles of the annotation.
## Configure the Axis and Stroke
Grid line and plot band annotations position themselves against an axis and support a stroke. Use the following properties to set the axis and customize the stroke:
* `Axis` (`Telerik.Maui.Controls.Charts.ChartAxis`)—Defines the axis against which the annotation is positioned. The axis must belong to the owning chart.
* `Stroke` (`Brush`)—Defines the stroke brush. The current theme provides the default brush.
* `StrokeThickness` (`double`)—Defines the stroke thickness in device-independent units. The value must be zero or greater, and `0` hides the stroke. The default value is `1`.
* `StrokeDashArray` (`DoubleCollection`)—Defines alternating dash and gap lengths in device-independent units. An empty collection draws a solid stroke. A pattern with an odd number of values repeats to form an even-length pattern.
> note The `Stroke` and `Fill` properties of annotations support only `SolidColorBrush` values.
## Mark a Value with a Grid Line
The `ChartGridLineAnnotation` draws a line across the plot area. Use it to mark a threshold, a target, or an average value. Set the following property to position the line:
* `Value` (`object`)—Defines the position of the line. The value can be a number, a `DateTime`, or a category, depending on the type of the `Axis`.
When the `Axis` is horizontal, the line is vertical. When the `Axis` is vertical, the line is horizontal.
## Highlight a Range with a Plot Band
The `ChartPlotBandAnnotation` fills the area between two positions on an axis. Use it to highlight an acceptable value range or a time period. Use the following properties to configure the band:
* `From` (`object`)—Defines one endpoint of the band.
* `To` (`object`)—Defines the other endpoint of the band. When `From` and `To` are equal, the band has zero area.
* `Fill` (`Brush`)—Defines the fill of the band. The current theme provides the default brush. Set `Fill` to `{x:Null}` to draw only the stroke of the band.
The band normalizes reversed endpoints according to the axis order. The band draws a stroke only at the `From` and `To` boundaries; the edges parallel to the axis have no stroke.
On a `CategoricalAxis`, the `ChartPlotBandAnnotation` boundaries are the category positions, which are the centers of the category slots. To include the complete slots, use the `ChartCategoricalPlotBandAnnotation`.
## Highlight Complete Categories
The `ChartCategoricalPlotBandAnnotation` extends the `ChartPlotBandAnnotation` for categorical axes. Use the following property to define how the band treats the endpoint categories:
* `CategoryBoundaryMode` (`enum` of type `Telerik.Maui.Controls.Charts.ChartCategoryBoundaryMode`)—Defines whether the band includes the complete category slots or cuts at the category positions. The available options are:
* (Default) `WholeCategorySlots`—Includes the complete slots of both endpoint categories. When `From` and `To` are equal, the band highlights one category.
* `CategoryPositions`—Uses the exact plotted positions of the endpoint categories.
## Add Annotations to the Chart
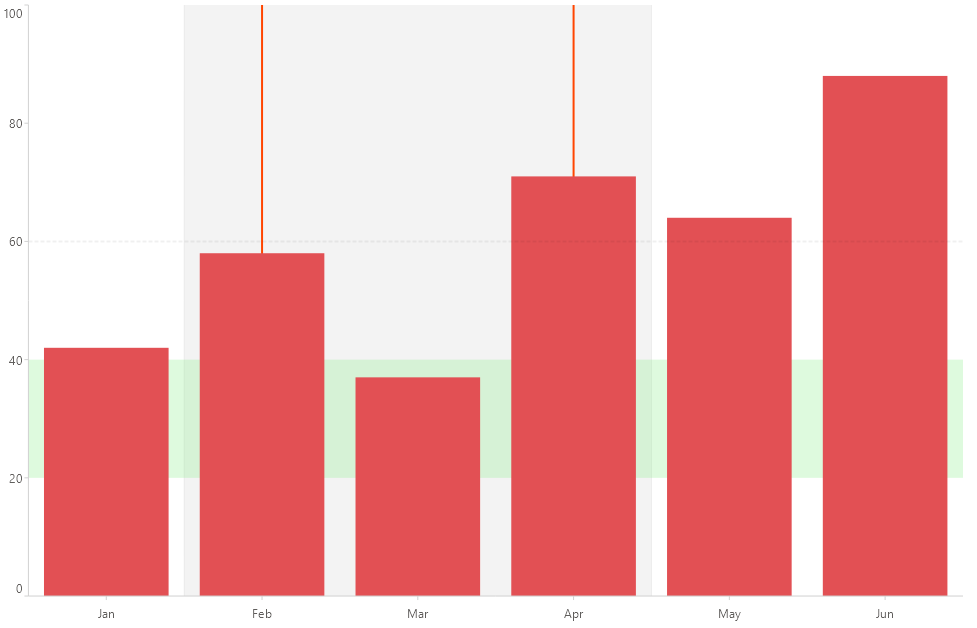
The following example shows a `BarSeries` with a categorical plot band, a stroke-only plot band, a value range band, and a dashed threshold line.
1. Define the chart, the axes, the series, and the annotations in Extensible Application Markup Language (XAML). The `Value` of the grid line binds to a `Slider` named `threshold`:
```XAML
```
2. Add the `charts` namespace:
```XAML
xmlns:charts="clr-namespace:Telerik.Maui.Controls.Charts;assembly=Telerik.Maui.Controls"
```
3. Add the data model:
```C#
public class CategoricalData
{
public string Category { get; set; }
public double Value { get; set; }
}
```
4. Add the `ViewModel`:
```C#
public class CategoricalViewModel
{
public ObservableCollection Data { get; } = new ObservableCollection
{
new CategoricalData { Category = "Jan", Value = 42 },
new CategoricalData { Category = "Feb", Value = 58 },
new CategoricalData { Category = "Mar", Value = 37 },
new CategoricalData { Category = "Apr", Value = 71 },
new CategoricalData { Category = "May", Value = 64 },
new CategoricalData { Category = "Jun", Value = 88 },
};
}
```
The following image shows the result. The band from `Feb` to `Apr` covers three complete categories, the green band marks the range from 20 to 40, and the dashed line marks the threshold value:
> tip For a runnable example with the Cartesian Chart annotations, go to the [SDKBrowser Demo Application](https://www.telerik.com/maui-ui/documentation/demos-and-sample-apps/sdkbrowser-app) and navigate to the **Charts > Features** category.
## See Also
* [Grid Lines](https://www.telerik.com/maui-ui/documentation/controls/charts/cartesian-chart/grid-lines)
* [Categorical Axis](https://www.telerik.com/maui-ui/documentation/controls/charts/cartesian-chart/axes/categorical-axis)
* [Numerical Axis](https://www.telerik.com/maui-ui/documentation/controls/charts/cartesian-chart/axes/numerical-axis)
* [Bar Series](https://www.telerik.com/maui-ui/documentation/controls/charts/cartesian-chart/series/bar-series)