# .NET MAUI Chart Candlestick Series
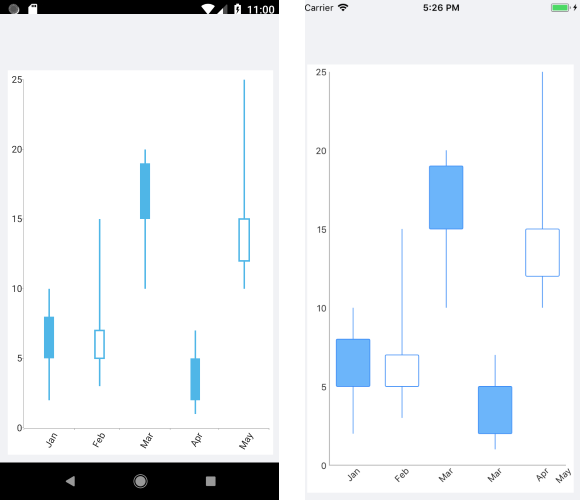
The Cartesian Chart visualizes each data point from the Candlestick Series as a visual that resembles a candlestick. This is a typical financial series that can be used to visualize the state of a market for a period of time. The series operates with a special data in the form of four parameters defining the stock market - **open**, **high**, **low**, and **close**. The **high** and **low** values show the price range (the highest and lowest prices) over one unit of time. The **open** and **close** values indicate the opening and closing price of the stock for the corresponding period
## Example
The following example shows how to create a basic `RadCartesianChart` with a Candlestick Series in XAML and C#.
**1.** Define the `RadCartesianChart`.
```XAML
```
**2.** Define the business model:
```C#
public class OhlcDataPoint : NotifyPropertyChangedBase
{
private DateTime category;
private double open;
private double high;
private double low;
private double close;
public DateTime Category
{
get { return this.category; }
set
{
if (value != this.category)
{
this.category = value;
this.OnPropertyChanged();
}
}
}
public double Open
{
get { return this.open; }
set
{
if (value != this.open)
{
this.open = value;
this.OnPropertyChanged();
}
}
}
public double High
{
get { return this.high; }
set
{
if (value != this.high)
{
this.high = value;
this.OnPropertyChanged();
}
}
}
public double Low
{
get { return this.low; }
set
{
if (value != this.low)
{
this.low = value;
this.OnPropertyChanged();
}
}
}
public double Close
{
get { return this.close; }
set
{
if (value != this.close)
{
this.close = value;
this.OnPropertyChanged();
}
}
}
}
```
**3.** And the ViewModel:
```C#
public class ViewModel
{
public ViewModel()
{
this.SeriesData = LoadData();
}
public ObservableCollection SeriesData { get; private set; }
public ObservableCollection LoadData()
{
ObservableCollection points = new ObservableCollection();
points.Add(new OhlcDataPoint(){ Category = DateTime.ParseExact("03-01-2011", "dd-MM-yyyy", null), Open = 325.64, High = 330.26, Low = 324.84, Close = 329.57 });
points.Add(new OhlcDataPoint(){ Category = DateTime.ParseExact("04-01-2011", "dd-MM-yyyy", null), Open = 332.44, High = 332.50, Low = 328.15, Close = 331.29 });
points.Add(new OhlcDataPoint(){ Category = DateTime.ParseExact("06-01-2011", "dd-MM-yyyy", null), Open = 329.55, High = 334.34, Low = 329.50, Close = 334.00 });
points.Add(new OhlcDataPoint(){ Category = DateTime.ParseExact("07-01-2011", "dd-MM-yyyy", null), Open = 334.72, High = 335.25, Low = 332.90, Close = 333.73 });
points.Add(new OhlcDataPoint(){ Category = DateTime.ParseExact("10-01-2011", "dd-MM-yyyy", null), Open = 333.99, High = 336.35, Low = 331.90, Close = 336.12 });
points.Add(new OhlcDataPoint(){ Category = DateTime.ParseExact("11-01-2011", "dd-MM-yyyy", null), Open = 338.83, High = 343.23, Low = 337.17, Close = 342.45 });
points.Add(new OhlcDataPoint(){ Category = DateTime.ParseExact("12-01-2011", "dd-MM-yyyy", null), Open = 344.88, High = 344.96, Low = 339.47, Close = 341.64 });
points.Add(new OhlcDataPoint(){ Category = DateTime.ParseExact("13-01-2011", "dd-MM-yyyy", null), Open = 343.25, High = 344.43, Low = 342.00, Close = 344.42 });
points.Add(new OhlcDataPoint(){ Category = DateTime.ParseExact("14-01-2011", "dd-MM-yyyy", null), Open = 345.16, High = 346.64, Low = 343.85, Close = 345.68 });
points.Add(new OhlcDataPoint(){ Category = DateTime.ParseExact("18-01-2011", "dd-MM-yyyy", null), Open = 345.89, High = 348.48, Low = 344.44, Close = 348.48 });
points.Add(new OhlcDataPoint(){ Category = DateTime.ParseExact("19-01-2011", "dd-MM-yyyy", null), Open = 329.52, High = 344.76, Low = 326.00, Close = 340.65 });
points.Add(new OhlcDataPoint(){ Category = DateTime.ParseExact("20-01-2011", "dd-MM-yyyy", null), Open = 348.35, High = 348.60, Low = 336.88, Close = 338.84 });
points.Add(new OhlcDataPoint(){ Category = DateTime.ParseExact("21-01-2011", "dd-MM-yyyy", null), Open = 336.43, High = 338.30, Low = 330.12, Close = 332.68 });
points.Add(new OhlcDataPoint(){ Category = DateTime.ParseExact("24-01-2011", "dd-MM-yyyy", null), Open = 333.77, High = 334.88, Low = 326.63, Close = 326.72 });
points.Add(new OhlcDataPoint(){ Category = DateTime.ParseExact("25-01-2011", "dd-MM-yyyy", null), Open = 326.87, High = 337.45, Low = 326.72, Close = 337.45 });
points.Add(new OhlcDataPoint(){ Category = DateTime.ParseExact("26-01-2011", "dd-MM-yyyy", null), Open = 336.33, High = 341.44, Low = 334.57, Close = 341.40});
points.Add(new OhlcDataPoint(){ Category = DateTime.ParseExact("27-01-2011", "dd-MM-yyyy", null), Open = 342.96, High = 345.60, Low = 341.50, Close = 343.85 });
points.Add(new OhlcDataPoint(){ Category = DateTime.ParseExact("28-01-2011", "dd-MM-yyyy", null), Open = 343.78, High = 344.69, Low = 342.83, Close = 343.21 });
points.Add(new OhlcDataPoint(){ Category = DateTime.ParseExact("31-01-2011", "dd-MM-yyyy", null), Open = 344.17, High = 344.40, Low = 333.53, Close = 336.10 });
points.Add(new OhlcDataPoint(){ Category = DateTime.ParseExact("02-02-2011", "dd-MM-yyyy", null), Open = 335.8, High = 340.04, Low = 334.30, Close = 339.32 });
points.Add(new OhlcDataPoint(){ Category = DateTime.ParseExact("03-02-2011", "dd-MM-yyyy", null), Open = 343.8, High = 344.24, Low = 338.55, Close = 343.44 });
return points;
}
}
```
The following image shows the end result:
## See Also
* [Ohlc Series Overview](https://www.telerik.com/maui-ui/documentation/controls/chart/series/financial/ohlc-series)
* [Financial Indicators](https://www.telerik.com/maui-ui/documentation/controls/chart/series/financial/financial-indicators)