# .NET MAUI Chart Legend
The Legend feature of the `RadChart` provide description about the series which are visualized within the control.
**1.** Initialize a new object of type `RadLegend`.
```XAML
```
**2.** Add the `ViewModel`:
```C#
public class ViewModel
{
public ViewModel()
{
this.Data1 = GetCategoricalData();
this.Data2 = GetCategoricalData2();
this.Data3 = GetCategoricalData3();
}
public ObservableCollection Data1 { get; set; }
public ObservableCollection Data2 { get; set; }
public ObservableCollection Data3 { get; set; }
private static ObservableCollection GetCategoricalData()
{
var data = new ObservableCollection {
new CategoricalData { Category = "A", Value = 0.63 },
new CategoricalData { Category = "B", Value = 0.85 },
new CategoricalData { Category = "C", Value = 1.05 },
new CategoricalData { Category = "D", Value = 0.96 },
new CategoricalData { Category = "E", Value = 0.78 },
};
return data;
}
private static ObservableCollection GetCategoricalData2()
{
var data = new ObservableCollection {
new CategoricalData { Category = "A", Value = 0.13 },
new CategoricalData { Category = "B", Value = 0.35 },
new CategoricalData { Category = "C", Value = 0.55 },
new CategoricalData { Category = "D", Value = 0.46 },
new CategoricalData { Category = "E", Value = 0.28 },
};
return data;
}
private static ObservableCollection GetCategoricalData3()
{
var data = new ObservableCollection {
new CategoricalData { Category = "A", Value = 1.63 },
new CategoricalData { Category = "B", Value = 1.85 },
new CategoricalData { Category = "C", Value = 2.05 },
new CategoricalData { Category = "D", Value = 1.96 },
new CategoricalData { Category = "E", Value = 1.78 },
};
return data;
}
}
```
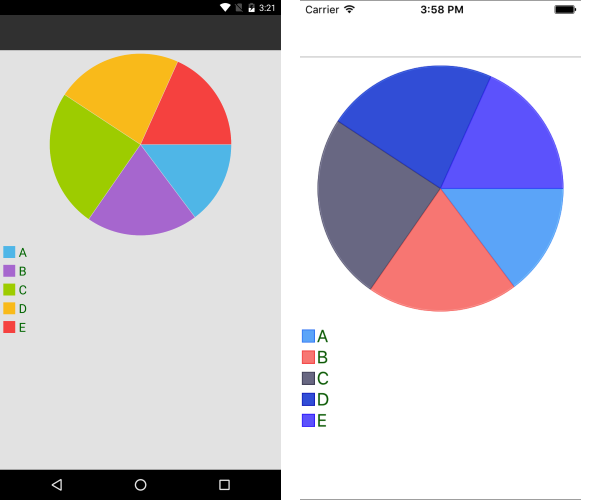
The following image shows the `RadLegend` in combination with the Pie Chart.
## Properties
As shown in the previous image, each item within the `RadLegend` represents a specific series. The most important property which you need to set is the `LegendProvider`. It will point to the chart object whose series will be included in the legend.
The following list summarizes the most important properties of the `RadLegend` control. In brackets is commented the type of the property:
* `LegendProvider` (`RadChartBase`)—The Chart control whose series will be described in the legend.
* `LegendItemFontSize` (`double`)—The size of the item's title text.
* `LegendItemFontColor` (`Color`)—The color of the item's title text.
* `LegendItemIconSize` (`Size`)—The size of the title icons.
* `Orientation` (`LegendOrientation`)—Sets the orientation of the legend. Can be `Horizontal` or `Vertical`.
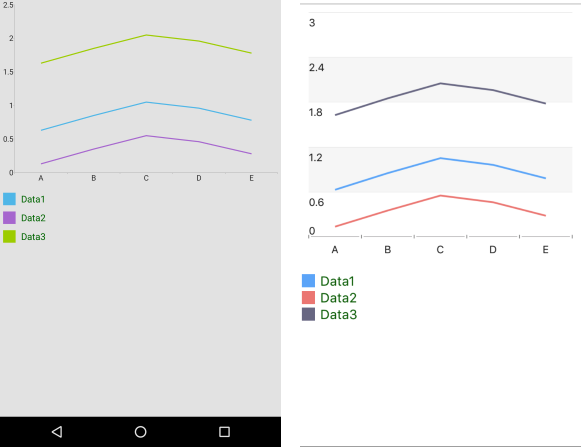
`RadLegend` can be used in combination with `RadCartesianChart` as well.
The following example demonstrates how to define some of the most important Chart legend properties.
**1.** Define the `RadLegend` in XAML:
```XAML
```
**2.** Define the `ViewModel`:
```C#
public class ViewModel
{
public ViewModel()
{
this.Data1 = GetCategoricalData();
this.Data2 = GetCategoricalData2();
this.Data3 = GetCategoricalData3();
}
public ObservableCollection Data1 { get; set; }
public ObservableCollection Data2 { get; set; }
public ObservableCollection Data3 { get; set; }
private static ObservableCollection GetCategoricalData()
{
var data = new ObservableCollection {
new CategoricalData { Category = "A", Value = 0.63 },
new CategoricalData { Category = "B", Value = 0.85 },
new CategoricalData { Category = "C", Value = 1.05 },
new CategoricalData { Category = "D", Value = 0.96 },
new CategoricalData { Category = "E", Value = 0.78 },
};
return data;
}
private static ObservableCollection GetCategoricalData2()
{
var data = new ObservableCollection {
new CategoricalData { Category = "A", Value = 0.13 },
new CategoricalData { Category = "B", Value = 0.35 },
new CategoricalData { Category = "C", Value = 0.55 },
new CategoricalData { Category = "D", Value = 0.46 },
new CategoricalData { Category = "E", Value = 0.28 },
};
return data;
}
private static ObservableCollection GetCategoricalData3()
{
var data = new ObservableCollection {
new CategoricalData { Category = "A", Value = 1.63 },
new CategoricalData { Category = "B", Value = 1.85 },
new CategoricalData { Category = "C", Value = 2.05 },
new CategoricalData { Category = "D", Value = 1.96 },
new CategoricalData { Category = "E", Value = 1.78 },
};
return data;
}
}
```
The following image shows the `RadLegend` control in combination with a Cartesian Chart.
## Legend Title Binding
The `LegendTitleBinding` is a property which can be set for the Pie Series. It points to the property of the data item which will be used as a title in the legend. For all other series, the `DisplayName` property will be used instead.
```XAML
```
## See Also
* [CartesianChartGrid](https://www.telerik.com/maui-ui/documentation/controls/chart/grid)
* [Annotations](https://www.telerik.com/maui-ui/documentation/controls/chart/annotations)