# Date Series
You can control the display of dates in the Kendo UI Chart.
## Date Series in Categorical Charts
[Categorical charts](https://www.telerik.com/kendo-jquery-ui/documentation/controls/charts/chart-types/categorical-charts) and other Kendo UI chart types provide built-in support for displaying dates, including the following scenarios:
* Automatic selection of granularity or base unit (minutes, hours, days, and so on).
* Label formatting that is matched to the granularity.
* Grouping of categories into base units and series aggregates.
Specifying categories of type `Date` switches the axis to a date mode. The automatic mode selection can be overridden by setting [`categoryAxis.type`](https://www.telerik.com/kendo-jquery-ui/documentation/api/dataviz/chart#configuration-categoryAxis.type) to `Date`.
### Date Binding
To bind the date series, use [`categoryField`](https://www.telerik.com/kendo-jquery-ui/documentation/api/dataviz/chart#configuration-series.categoryField). The categories (dates) for all series are sorted and merged during data binding.
### Date Grouping
If the series contain two or more values for a specific period (base unit), they are aggregated to display a single value.
> The dates have to match the source.
```
```
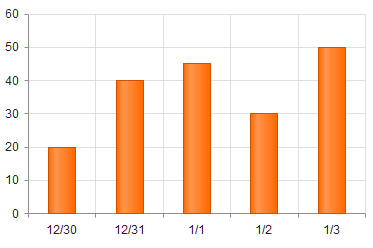
The following image demonstrates a chart with a set date category axis.
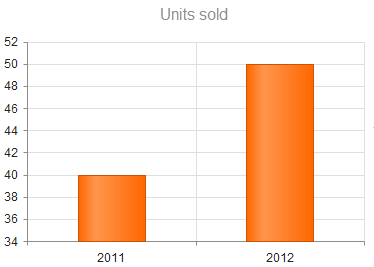
The following example demonstrates date series that are grouped by the year.
```
```
The following image displays a chart with a grouped date category axis. Note how the maximum value for each year is now displayed.
### Setting Aggregates
You can set an aggregate type for each series.
The following options are available:
* `min`
* (Default) `max`
* `count`
* `sum`
* `avg`
* `first`
* `function`
The following example demonstrates how to handle date grouping with the `sum` aggregate.
```
```
### Setting Base Units
To set the base units in the categorical charts, use any of the following approaches:
* [Default configuration](https://www.telerik.com/kendo-jquery-ui/documentation/controls/charts/elements/date-series#default-configuration)
* [Manual configuration](https://www.telerik.com/kendo-jquery-ui/documentation/controls/charts/elements/date-series#manual-configuration)
* [Automatic fitting](https://www.telerik.com/kendo-jquery-ui/documentation/controls/charts/elements/date-series#automatic-fitting)
* [Labels format](https://www.telerik.com/kendo-jquery-ui/documentation/controls/charts/elements/date-series#label-format)
#### Default Configuration
To determine a default base, use the smallest duration between categories.
```
categoryAxis: {
categories: [new Date(2005, 0, 1), new Date(2006, 0, 1)]
// baseUnit is set to "years"
}
categoryAxis: {
categories: [new Date(2005, 1, 1), new Date(2005, 1, 2)]
// baseUnit is set to "days"
}
```
#### Manual Configuration
You can also manually specify the [`baseUnit`](https://www.telerik.com/kendo-jquery-ui/documentation/api/dataviz/chart#configuration-categoryAxis.baseUnit). To display every nth base unit, set the [`baseUnitStep`](https://www.telerik.com/kendo-jquery-ui/documentation/api/dataviz/chart#configuration-categoryAxis.baseUnitStep) option.
The following options are valid for `baseUnit`:
* Seconds
* Minutes
* Hours
* Days
* Weeks
* Months
* Years
* [Fit](https://www.telerik.com/kendo-jquery-ui/documentation/controls/charts/elements/date-series#automatic-fitting)
#### Automatic Fitting
Setting the [`baseUnit`](https://www.telerik.com/kendo-jquery-ui/documentation/api/dataviz/chart#configuration-categoryAxis.baseUnit) to `fit` constrains the total number of base units to [`maxDateGroups`](https://www.telerik.com/kendo-jquery-ui/documentation/api/dataviz/chart#configuration-categoryAxis.baseUnit). The `baseUnit` and `baseUnitStep` are selected according to the [`autoBaseUnitSteps`](https://www.telerik.com/kendo-jquery-ui/documentation/api/dataviz/chart#configuration-categoryAxis.autoBaseUnitSteps).
```
```
#### Labels Format
The date category axis provides options for specifying one format per base unit. If specified, the [`labels.format` property](https://www.telerik.com/kendo-jquery-ui/documentation/api/dataviz/chart#categoryaxis.labels.format-string) takes priority. The global `KendoUI` culture is used for formatting the dates and can be overridden by setting the `labels.culture`.
```
categoryAxis: {
labels: {
dateFormats: {
days: "M/d"
}
}
}
```
#### Displaying the Axis Date Range
To display the exact start and end date of the axis range, set the [`rangeLabels.visible` property](https://www.telerik.com/kendo-jquery-ui/documentation/api/dataviz/ui/chart/configuration/categoryaxis#categoryaxisrangelabels#categoryaxisrangelabelsvisible) to `true`.
The range labels support the same settings as the axis labels. If an option is not set, it will default to the value set for the regular labels. For example [`rangeLabels.color`](https://www.telerik.com/kendo-jquery-ui/documentation/api/dataviz/ui/chart/configuration/categoryaxis#categoryaxisrangelabels#categoryaxisrangelabelscolor) defaults to the value of [`labels.color`](https://www.telerik.com/kendo-jquery-ui/documentation/api/dataviz/ui/chart/configuration/categoryaxis#categoryaxislabels#categoryaxislabelscolor).
Toggle the range labels in the example below to see how they differ from the regular axis labels:
```
```
## Date Series in Scatter Charts
[Scatter charts](https://www.telerik.com/kendo-jquery-ui/documentation/controls/charts/chart-types/scatter-charts) provide built-in support for displaying dates, including:
* Automatic selection of granularity or base unit (minutes, hours, days, and so on).
* Label formatting that is matched to the granularity.
If the series values are of type `Date`, the X and Y axes switch into date mode. To override the automatic mode selection, specify `type: "Date"`.
The following options accept dates:
* [`min`](https://www.telerik.com/kendo-jquery-ui/documentation/api/dataviz/chart#configuration-xAxis.min)
* [`max`](https://www.telerik.com/kendo-jquery-ui/documentation/api/dataviz/chart#configuration-xAxis.max)
* [`axisCrossingValue`](https://www.telerik.com/kendo-jquery-ui/documentation/api/dataviz/chart#configuration-xAxis.axisCrossingValue)
The following options are expressed in base units:
* [`minorUnit`](https://www.telerik.com/kendo-jquery-ui/documentation/api/dataviz/chart#configuration-xAxis.minorUnit)
* [`majorUnit`](https://www.telerik.com/kendo-jquery-ui/documentation/api/dataviz/chart#configuration-xAxis.majorUnit)
### Setting Base Units
To set the base units in the scatter charts, use any of the following approaches:
* [Default configuration](https://www.telerik.com/kendo-jquery-ui/documentation/controls/charts/elements/date-series#default-configuration)
* [Manual configuration](https://www.telerik.com/kendo-jquery-ui/documentation/controls/charts/elements/date-series#manual-configuration)
* [Labels format](https://www.telerik.com/kendo-jquery-ui/documentation/controls/charts/elements/date-series#label-format)
#### Default Configuration
The default base unit is determined by the axis (or series) range.
```
xAxis: {
min: new Date(2005, 0, 1),
max: new Date(2006, 0, 1)
// baseUnit is set to "years"
}
xAxis: {
min: new Date(2005, 1, 1),
max: new Date(2005, 1, 2)
// baseUnit is set to "days"
}
```
#### Manual Configuration
You can also manually specify the base unit by using the following valid options:
* Seconds
* Minutes
* Hours
* Days
* Weeks
* Months
* Years
#### Labels Format
The date axis provides options for specifying one format per base unit. If specified, the [`labels.format` property](https://www.telerik.com/kendo-jquery-ui/documentation/api/dataviz/chart#xAxis.labels.format) takes priority. The global `KendoUI` culture is used for formatting the dates and can be overridden by setting the [`labels.culture`](https://www.telerik.com/kendo-jquery-ui/documentation/api/dataviz/chart#xAxis.labels.culture) property.
```
xAxis: {
labels: {
dateFormats: {
days: "M/d"
}
}
}
```
## See Also
* [Using the API of the Chart (Demo)](https://demos.telerik.com/kendo-ui/chart-api/index)
* [JavaScript API Reference of the Chart](https://www.telerik.com/kendo-jquery-ui/documentation/api/dataviz/ui/chart)