90 Answers, 1 is accepted


Yes, you can create custom behavior like popup dialog when user click on selected chart value.
For example lets assume we are using pie-chart
pie-char.xml
<chart:RadPieChart id="pieChart" height="300" allowAnimation="true" row="0"> <chart:RadPieChart.series> <chart:PieSeries selectionMode="DataPoint" expandRadius="1.3" outerRadiusFactor="0.7" items="{{ pieSource }}" valueProperty="Amount" legendLabelProperty="Brand"> </chart:PieSeries> </chart:RadPieChart.series> <chart:RadPieChart.legend> <chart:RadLegendView position="Floating" offsetOrigin="TopRight" width="150"/> </chart:RadPieChart.legend></chart:RadPieChart>pie-char.js
"use strict";// >> export your own binding-context-pie-seriesvar pieModelModule = require("../../data-models/pie-data-model");var dialogs = require("ui/dialogs");function onPageLoaded(args) { var page = args.object; page.bindingContext = new pieModelModule.PieDataModel(); var pieChart = page.getViewById("pieChart"); pieChart.on("pointSelected", function (args) { dialogs.alert({ title: "Your title", message: "Your messsage", okButtonText: "Your button text" }).then(function () { console.log("Dialog closed!"); }); });}exports.onPageLoaded = onPageLoaded;What the above example do is the following:
- get a reference to you pie-char via
getViewById("pieChart")- create an eventListener - in this case on pointSelected which will fire when the user interacts with a pie point.
- use the callback function to introduce your own behavior on what should happen when the event is fired. In this case the function will use the NativeScript dialogs module and will show an alert dialog box.
More about dialogs you can find here .
I am also recommending the great documentation about telerik-ui-pro components where you can find very good information about all functionalities for charts.
Direct link to telerik-ui-pro chart : http://docs.telerik.com/devtools/nativescript-ui/Controls/NativeScript/Chart/overview
Regards,
Nikolay Iliev
Telerik

Hello Nikolay Iliev,
Thanks your reply, Then how can show my var pieModelModule = require("../../data-models/pie-data-model"); data into my dialog box this is the issue i am facing now.
I must have missed this information in my previous answer!
You should create or use your own view-model which is passing the data to present in the chart.
In the example provided the file was two directories above your current file (../../) in folder data-models and in file pie-data-model.js and looks like this:
"use strict";var dependencyObservableModule = require("ui/core/dependency-observable");var PieDataModel = (function (_super) { __extends(PieDataModel, _super); function PieDataModel() { _super.call(this); this.initData(); } PieDataModel.prototype.initData = function () { this.set("pieSource", [ { Brand: "Audi", Amount: 10 }, { Brand: "Mercedes", Amount: 76 }, { Brand: "Fiat", Amount: 60 }, { Brand: "BMW", Amount: 24 }, { Brand: "Crysler", Amount: 40 } ]); }; return PieDataModel;}(dependencyObservableModule.DependencyObservable));exports.PieDataModel = PieDataModel;This example is good representation of the models in MVVM design pattern which is great concept for structuring your application so you can re-use your code without creating unwanted dependencies and with clear separation of your Models, Views and View-Models.
Of course the simpler solution (no MVVM but easier for testing purposes) is to directly feed your chart values with code in your pie-chart.js like this
var observableArrayModule = require("data/observable-array");var brandsArray = new observableArrayModule.ObservableArray([ { Brand: "Audi", Amount: 10 }, { Brand: "Mercedes", Amount: 76 }, { Brand: "Fiat", Amount: 60 }, { Brand: "BMW", Amount: 24 }, { Brand: "Crysler", Amount: 40 }]);
var pieData = new observableArrayModule.Observable();
pieData.set("pieSource", brandsArray );

page.bindingContext = pieData;
The whole scenario with examples for all telerik-ui-pro components can be found at the following link:
https://github.com/telerik/nativescript-ui-samples
All you need to do is to clone this repository, navigate to sdk folder and run the app. In the code for pi-chart you will find the example that we have discussed and you will also find a nice samples for each other chart that you can create.
Regards,
Nikolay Iliev
Telerik
Hello Nikolay Iliev
I think you did't get my question my question was In a chart i have displayed values form view-model.js but now i want to do in that data i want to show in a dialog box when i click on that particular bar details.
My Code:
chart.xml
<Page xmlns:navigation="navigation/example-page" loaded="onPageLoaded" xmlns:chart="nativescript-telerik-ui-pro/chart" xmlns="http://www.nativescript.org/tns.xsd">
<GridLayout orientation="vertical" rows="*, *">
<chart:RadCartesianChart row="1" id="pieChart">
<chart:RadCartesianChart.grid>
<chart:RadCartesianChartGrid
horizontalLinesVisible="true"
verticalLinesVisible="true"
horizontalStripLinesVisible="true"
verticalStripLinesVisible="true"
verticalStrokeColor="#804d0026"
horizontalStrokeColor="#ffffcc80"
horizontalStrokeWidth="2"
verticalStrokeWidth="3"
horizontalStripLineColor="#8059005c, #804d0026"
/>
</chart:RadCartesianChart.grid>
<chart:RadCartesianChart.series>
<chart:BarSeries items="{{ categoricalSource }}" categoryProperty="Country" valueProperty="Amount" selectionMode="DataPoint">
</chart:BarSeries>
<chart:RadCartesianChart.horizontalAxis>
<chart:CategoricalAxis />
</chart:RadCartesianChart.horizontalAxis>
<chart:RadCartesianChart.verticalAxis>
<chart:LinearAxis />
</chart:RadCartesianChart.verticalAxis>
</chart:RadCartesianChart.series>
</chart:RadCartesianChart>
</GridLayout>
</Page>
chart.js
var frameModule = require("ui/frame");
var dialogs = require("ui/dialogs");
var dataModelModule = require("./chart-view-model");
function onPageLoaded(args) {
var page = args.object;
page.bindingContext = new dataModelModule.CategoricalDataModel();
var pieChart = page.getViewById("pieChart");
pieChart.on("pointSelected", function (args) {
dialogs.alert({
title: "Country",
message: "Amount",
okButtonText: "OK"
}).then(function () {
console.log("Dialog closed!");
});
});
};
exports.onPageLoaded = onPageLoaded;
chart-view-model.js
var PieDataModel = (function () {
function PieDataModel() {
}
Object.defineProperty(PieDataModel.prototype, "categoricalSource", {
// >> categorical-source
get: function () {
return [
{ Country: "Germany", Amount: 25 },
{ Country: "France", Amount: 13 },
{ Country: "Bulgaria", Amount: 24 },
{ Country: "Spain", Amount: 11 },
{ Country: "India", Amount: 20 },
{ Country: "China", Amount: 13 },
{ Country: "Nepal", Amount: 12 },
{ Country: "Europe", Amount: 11 },
{ Country: "Russia", Amount: 5 }
]
}
,
enumerable: true,
configurable: true
});
return PieDataModel;
}());
exports.PieDataModel = PieDataModel;
var frameModule = require("ui/frame");
var dialogs = require("ui/dialogs");
var dataModelModule = require("./chart-view-model");
function onPageLoaded(args) {
var page = args.object;
page.bindingContext = new dataModelModule.CategoricalDataModel();
var pieChart = page.getViewById("pieChart");
pieChart.on("pointSelected", function (args) {
dialogs.alert({
title: "Country",
message: "Amount",
okButtonText: "OK"
}).then(function () {
console.log("Dialog closed!");
});
});
};
exports.onPageLoaded = onPageLoaded;
see in this dialog box i want to show this data
return [
{ Country: "Germany", Amount: 25 },
{ Country: "France", Amount: 13 },
{ Country: "Bulgaria", Amount: 24 },
{ Country: "Spain", Amount: 11 },
{ Country: "India", Amount: 20 },
{ Country: "China", Amount: 13 },
{ Country: "Nepal", Amount: 12 },
{ Country: "Europe", Amount: 11 },
{ Country: "Russia", Amount: 5 }
]
Here is the deal - when you are creating an event listener with pointSelected you are going to receive in your callback function arguments passed from that entity (the selected point that triggered the event)
In this case you have several arguments one of which is pointIndex which you can use to get the specific item from your model.
For example:
"use strict";var observable_1 = require("data/observable");var observable_array_1 = require("data/observable-array");var dialogs = require("ui/dialogs");
var pieData = new observable_1.Observable();var countries = new observable_array_1.ObservableArray([ { Country: "Germany", Amount: 25 }, { Country: "France", Amount: 13 }, { Country: "Bulgaria", Amount: 24 }, { Country: "Spain", Amount: 11 }, { Country: "India", Amount: 20 }, { Country: "China", Amount: 13 }, { Country: "Nepal", Amount: 12 }, { Country: "Europe", Amount: 11 }, { Country: "Russia", Amount: 5 }]);pieData.set("pieSource", countries);
function onPageLoaded(args) { var page = args.object; page.bindingContext = pieData; var pieChart = page.getViewById("pieChart"); pieChart.on("pointSelected", function (args) { console.log("index of the selected point: " + args.pointIndex); var selectedCountry = countries.getItem(args.pointIndex); dialogs.alert({ title: "Country: " + selectedCountry.Country, message: "Amount: " + selectedCountry.Amount, okButtonText: "Your button text" }).then(function () { console.log("Dialog closed!"); }); });}exports.onPageLoaded = onPageLoaded;What I want to point out about observable-array that in order to return an element with index you should use yourObservableArray.getItem(yourIndex);
If you don't need observable-array then you can just use the standard JavaScript array indexing like yourArray[yourndex];
Regards,
Nikolay Iliev
Telerik
Thanks now its working...
Hello Nikolay Iliev,
I have another doubt concerning local json data calling
See i have a local json like this,
{
"employees": [
{
"firstName": "John",
"lastName": "Doe"
},
{
"firstName": "Anna",
"lastName": "Smith"
},
{
"firstName": "Peter",
"lastName": "Jones"
}
]
}
this local data i want to show on my ui label or where i want to be. How will be the code?
var fs = require('file-system');
var observableArrayModule = require("data/observable-array");
var array = new observableArrayModule.ObservableArray();
var array;
var documents = fs.knownFolders.currentApp();
var jsonFile = documents.getFile('shared/demo.json');
var jsonData;
jsonFile.readText()
.then(function (content) {
try {
jsonData = JSON.parse(content);
array = new observableArrayModule.ObservableArray(jsonData);
} catch (err) {
throw new Error('Could not parse JSON file');
}
}, function (error) {
throw new Error('Could not read JSON file');
});
data is coming but i need this data in a particular field..
To resolve your issue you need to parse your JSON and pass it to your view-model in way that suits uyour needs. I will show you how to parse the data from the JSON file and pass it to a list-view so you can have a list of all employees with fisrt and last names.
For example:
main-page.xml
<Page xmlns="http://schemas.nativescript.org/tns.xsd" navigatingTo="navigatingTo"> <StackLayout> <Label text="All Employees" /> <ListView items="{{ employees }}" loaded="onLoaded" itemTap="onItemTap"> <ListView.itemTemplate> <StackLayout> <Label text="{{ firstName }}" textWrap="true" /> <Label text="{{ lastName }}" textWrap="true" /> </StackLayout> </ListView.itemTemplate> </ListView> </StackLayout></Page>main-page.js
"use strict";var observable_1 = require("data/observable");var observable_array_1 = require("data/observable-array");var fs = require("file-system");var mainViewModel = new observable_1.Observable();var documents = fs.knownFolders.currentApp();var jsonFile = documents.getFile('shared/demo.json');var employeesArray = new observable_array_1.ObservableArray();function navigatingTo(args) { var page = args.object; jsonFile.readText() .then(function (content) { try { var jsonData = JSON.parse(content); for (var key in jsonData) { // as your json has specific structure we have to parse it as needed // in this case we are looking for the key with value "employees" // and then we are goind level down to push all employees into our array if (jsonData.hasOwnProperty(key) && key.toString() === "employees") { var employees = new Array(jsonData[key]); employees.forEach(function (element) { employeesArray.push(element); }); } } } catch (err) { throw new Error('Could not parse JSON file'); } }, function (error) { throw new Error('Could not read JSON file'); }); // here we set our created employeesArray to the property 'employees' // which we use for the list-view items in our xml mainViewModel.set("employees", employeesArray); // bind the mainViewModel to our page page.bindingContext = mainViewModel;}exports.navigatingTo = navigatingTo;You can find more infomration about list-view with observable-array here
Based on the same principal you can bind your models to other elements as well but loading an array
of elements is usually done with list-view creation.
Regards,
Nikolay Iliev
Telerik
Hello Nikolay Iliev,
thanks for your support, see i have another local josn like this
{
"Title": "The Cuckoo's Calling",
"Author": "Robert Galbraith",
"Genre": "classic crime novel",
"Detail": {
"Publisher": "Little Brown",
"Publication_Year": 2013,
"ISBN-13": 9781408704004,
"Language": "English",
"Pages": 494
},
"StudentName": {
"name": "Little Brown",
"DateOf Birth": 2013,
"phoneNo": 9781408704004,
"Language": "English",
"address": 494
},
"Price": [
{
"type": "Hardcover",
"price": 16.65
},
{
"type": "Kidle Edition",
"price": 7.03
}
]
}
i need to call this data into more than one page how can do that? another one question is i need to call this all data in one page different place how i do that?
eg xml:
<StackLayout cssClass="drawerMenuContent" id="bg-green" orientation="vertical">
<GridLayout cssClass="field-group" columns="auto, 50, *" rows="auto, auto, auto" tap="dailyReport">
<!-- Name -->
<Image src="res://boy" cssClass="slide-out-img1" stretch="aspectFill" />
<StackLayout col="1" colSpan="2" orientation="vertical">
<Label class="textName" text="Lekshmikath Deshpande" horizontalAlignment="stretch" />
<Label class="className" text="LKG A" horizontalAlignment="stretch" />
<HtmlView class="repDet" html="NativeScript provides a best-of-both-worlds development experience. Our cross-platform JavaScript modules give you the convenience of writing iOS and Android apps from a single JavaScript codebase, while our runtimes give you the power of accessing native APIs." />
</StackLayout>
</GridLayout>
1) What you need in order to have nice application architecture and in the same time easy code re-use is
the MVVM architectural patten
The idea behind it is that handles the separation of concerns in you application.
Organizing you application with MVVM means that you will have
- Models (your model data e.g. in your case the file that will handle the jsonData)
- Views : the UI xml files that handles how your application really looks
- View-Models : the code files that handles your logic and the binding within the Models and Views
I recommend the out Groceries application tutorial where in Chapter 3 the usage of MVVM pattern is covered.
Another very simple example of how to use a model in several files you can find at my sample app here
What is actually happening is that I have a model in app/shared/full-catalog-view-model.ts
which is re-used in /views/categories/ (where you will see many different categories) like this:
var full_catalog_view_model_1 = require("../../shared/full-catalog-view-model");And from the you can bind your view-model to the page binding context.
The great thing about using MVVM pattern is that if I decide some day to change the way that the data is passed in full-catalog-view-model.ts I will have to change only this file! All other files in my apps wont have to be changed (separation of concerns)
Another thing you may want to check out is how to pass the binding context.
For example if you have a page that list multiple options and from there with tap on specific item the users is redirected to details-page for that specific item you can pass you context like shown here.
The simplest way to see how MVVM works is to run
tns create myApp
or if you prefer TypeScript
tns create myApp --template tsc
which will create very basic app with basic MVVM used as main-view-model.js and HelloWorldModel()
2.) Just set your view-model to you page bindingContext
For example:
main-page.js
var myViewModel = new Observable();


myViewModel.set("lbl-title", "MY Own TITLE");

myViewModel.set("lbl-name", "SOME NAME");

myViewModel.set("btn-text", "TAP The Button");

myViewModel.set("current-minutes", 45);

myViewModel.set("current-hour", 9);


page.bindingContext = myViewModel;
main-page.xml
<Page xmlns="http://www.nativescript.org/tns.xsd" loaded="onLoaded" navigatedTo="onNavigatedTo"> <StackLayout> <Label text="{{ lbl-title }}" textWrap="true" /> <Label text="{{ lbl-name }}" textWrap="true" />
<StackLayout> <Button text="{{ btn-text }}" tap="" /> <TimePicker hour="{{ current-hour }}" minute="{{ current-minutes }}"></TimePicker>
</StackLayout> </StackLayout></Page>More about binding: http://docs.nativescript.org/core-concepts/bindings#binding-in-xml
Regards,
Nikolay Iliev
Telerik
Hi, I want to know how to connect http api and how to call api data in ui label..
For example: when I write in postman http//local host:8081/api
I will get message: hai I am Paulson
Tis value I need to show in front went ui... How?
In order to execute GET, POST, PUT or other network related operation you can use the NativeScript modules http or fetch. They support getting different kind of data (string, JSON, image, ect.) and which one to use is depending entirely on your server and business logic in the application.
For example:
var observable = require("data/observable");

var
http = require("http");var result; var viewModel = new observable.Observable();;function onLoaded(args) { var page = args.object; http.getJSON("https://httpbin.org/get").then(function (r) { // on success Argument (r) is JSON! result = r;
console.log(JSON.stringify(r)); console.log(result.url.toString()); // httpbin json has propery url console.log(result.origin.toString()); // httpbinjson has property origin }, function (e) { // no failure Argument (e) is Error! console.log(e); }); viewModel.set("my-url", result.url); viewModel.set("my-origin", result.origin);
page.bindingContext = viewModel;}and in your xml the labels to bind the data from your viewModel
<Label text="{{ my-url }}" textWrap="true" /><Label text="{{ my-origin }}" textWrap="true" />p.p. httpbin is third party test http request response service which you can use to test your application will string, json, images and GET, POST, PUT,, ect..
If your server response is string you can use
http.getString("your-server-address").then(function(r) { // Argument (r) is string! }, function (e) { /// Argument (e) is Error!})Hope that will help you out - for more advanced usage you can go thruogh Chapter-4 of our NativeScript tutorial.
Regards,
Nikolay Iliev
Telerik
Hi Nikolay Iliev
Thanks for your reply now i need to know how to add or show ui data in server means twoway binding
for example:
<TextField id="name" hint="User Name" keyboardType="email" class="textBox" text="{{ username }}" />
<TextField id="email" hint="Password" secure="true" class="textBox" />
this filed data how to show in server. when i add here some data that should be show in my backend.. how will do that?
var observableModule = require("data/observable");
var frameModule = require("ui/frame");
var http = require("http");
http.getJSON("http://192.168.0.12:8080/api").then(function (r) {
console.log(r.message)
labelMessage = r.message
}, function (e) {
// Argument (e) is Error!
console.log(e);
});
var labelMessage = new observableModule.Observable();
var pageData = new observableModule.Observable();
function pageLoaded(args) {
var page = args.object;
pageData.set("labelMessage", labelMessage);
page.bindingContext = pageData;
}
exports.pageLoaded = pageLoaded;
i am getting data from server using this code
XML: <label text="{{ labelMessage }}" tap="resetPassword" />
see next
i need the same way when i add data in text field how i will get data on backend that is my question
my XML:
<TextField id="name" hint="User Name" keyboardType="email" class="textBox" text=" here" />
<TextField id="email" hint="Password" secure="true" class="textBox" text=" here />
Few remarks:
- In your code you are creating multiple obsevable models which is not necessary.
All you need to do is
var pageData = new observableModule.Observable();pageData.set("labelMessage", labelMessage);<label text="{{ labelMessage }}" />- to send data to your server (for example: username & password) you can again use http or fetch modules with your own specific server API settings;
For example:
var fetch = require("fetch");fetch("https://httpbin.org/post", { method: "POST", headers: { "Content-Type": "application/json" }, body: JSON.stringify({ username: "myUsernameValue", password: "myPassValue" })}).then(r => { return r.json(); }).then(function (r) { // console.log(result);}, function (e) { // console.log("Error occurred " + e);});Or in your case get the value from labelMessage and POST it to the server like that
fetch("https://your-server-post-address-here", { method: "POST", headers: { "Content-Type": "application/json" }, body: JSON.stringify({ username: pageData.get("labelMessage") })}).then(r => { return r.json(); }).then(function (r) { // console.log(result);}, function (e) { // console.log("Error occurred " + e);});Of course user management is more complex theme and you should check what headers your server-API is requiring.. for example grant_type is one of the headers that are often required.
At this link you can find a sample tutorial that covers a basic login functionality.
Regards,
Nikolay Iliev
Telerik
IOS running error what can i do for fixxing this error?
Processing node_modules failed. Error: Command failed: /bin/sh -c ruby -e "require 'xcodeproj'; xcproj = Xcodeproj::Project.open('catalogApp.xcodeproj'); xcproj.recreate_user_schemes; xcproj.save"
/System/Library/Frameworks/Ruby.framework/Versions/2.0/usr/lib/ruby/2.0.0/universal-darwin13/rbconfig.rb:213: warning: Insecure world writable dir /usr/local in PATH, mode 040777
/System/Library/Frameworks/Ruby.framework/Versions/2.0/usr/lib/ruby/2.0.0/rubygems/core_ext/kernel_require.rb:55:in `require': cannot load such file -- xcodeproj (LoadError)
from /System/Library/Frameworks/Ruby.framework/Versions/2.0/usr/lib/ruby/2.0.0/rubygems/core_ext/kernel_require.rb:55:in `require'
from -e:1:in `<main>'
This error is usually caused because you need to secure the directory before install.
This is usually related to not set or broken disk permissions.
Its not NativeScript issue but more likely OS-permissions related issue.
To solve this run the following:
chmod o-w /usr/localIf it fails or return an error then probably you will need to run the command as a root.
sudo chmod o-w /usr/localIf you however are still experiencing this issue please relate to the solutions described by the SO community in the following discussion : http://stackoverflow.com/questions/5380671/getting-the-warning-insecure-world-writable-dir-home-chance-in-path-mode-04
Regards,
Nikolay Iliev
Telerik
Nativescript telerik ui pro chart
Advanced Capabilities,Multiple Data Sources,2-D and 3-D Charts
i need examples to do this chart..
https://lh5.googleusercontent.com/5SctNEO2cyUDMA5EuEk3gM9al_43N8ue5InuGPgiEsqXTXj1MOShd-UNdNrGIANofU33KA=w1342-h401
https://lh5.googleusercontent.com/gdpKd96hZnrg4EyEBId9OvkgHx5y2EllhS6SSOPA5EuH-GIrf0x442iw8mSIHU5Ffr4HNw=w1342-h401
i want like this type of charts
can i do using nativescript telerik ui pro chart plugin?
I recommend the Getting started tutorial for telerik-ui-pro Chart - in its first article the multiple data sources are covered with the following example.
Let say you have the following model:
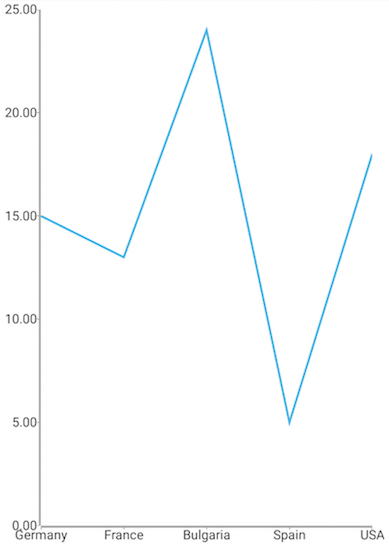
get categoricalSource() { return [ { Country: "Germany", Amount: 15, SecondVal: 14, ThirdVal: 24 }, { Country: "France", Amount: 13, SecondVal: 23, ThirdVal: 25 }, { Country: "Bulgaria", Amount: 24, SecondVal: 17, ThirdVal: 23 }, { Country: "Spain", Amount: 11, SecondVal: 19, ThirdVal: 24 }, { Country: "USA", Amount: 18, SecondVal: 8, ThirdVal: 21 } ]}Using the data from this model you can create the following chart
<navigation:ExamplePage xmlns:navigation="navigation/example-page" loaded="onPageLoaded" xmlns:chart="nativescript-telerik-ui-pro/chart" xmlns="http://www.nativescript.org/tns.xsd"> <chart:RadCartesianChart id="cartesianChart"> <chart:RadCartesianChart.series> <chart:LineSeries items="{{ categoricalSource }}" categoryProperty="Country" valueProperty="Amount"> <chart:LineSeries.horizontalAxis> <chart:CategoricalAxis/> </chart:LineSeries.horizontalAxis> <chart:LineSeries.verticalAxis> <chart:LinearAxis/> </chart:LineSeries.verticalAxis> </chart:LineSeries> </chart:RadCartesianChart.series> </chart:RadCartesianChart></navigation:ExamplePage>Which will generate this 2-D charts respectively for Android and iOS
3-D charts are currently not available for NativeScript telerik-ui-pro.
Here is the list of functionalities that NativeScript telerik-ui-pro chart is providing:
- 13 chart types
- Numeric, categorical, date-time axes
- Styling customizations
- Interaction: pan & zoom, selection
- Annotations: line, plot
- Trackball
In our chart documentation you will find a lot of extended code-samples and examples of how to create, bind and use the different functionalities of telerik-ui charts
Regards,
Nikolay Iliev
Telerik
can i set -10 amount under the x acces line in native script chart and i need more explanation in multi data bar how to do in chart.
ex:
imge1
https://lh5.googleusercontent.com/5SctNEO2cyUDMA5EuEk3gM9al_43N8ue5InuGPgiEsqXTXj1MOShd-UNdNrGIANofU33KA=w1342-h401
imge2
https://lh5.googleusercontent.com/gdpKd96hZnrg4EyEBId9OvkgHx5y2EllhS6SSOPA5EuH-GIrf0x442iw8mSIHU5Ffr4HNw=w1342-h401
1.) About using negative values in charts
Yes you can set negative values on our charts
Nice documentation article about this you can find at telerik-ui-pro documentation under
Controls > NativeScript > Chart > Axes > Negatie Values
Direct link : http://docs.telerik.com/devtools/nativescript-ui/Controls/NativeScript/Chart/Axes/negative-values
What is actually happening here is taht you should check if the axis you are using is supporting
minim and maximum values and add the range like this :
<chart:LinearAxis allowZoom="true" minimum="-50" maximum="50"/>The chart axis that supports minimum and maximum values in telerik-ui-pro are the following:
The best source to check what properties, fields and methods the telerik-ui-pro component is supporting is
using the API reference
2.) About multiple data in chart bars
Here is a basic example for usage of multi-data and creating bar chart with line chart
page.xml
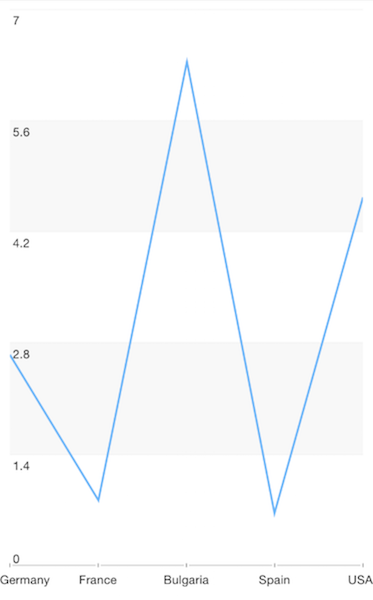
<Page xmlns="http://schemas.nativescript.org/tns.xsd" navigatingTo="navigatingTo" loaded="onPageLoaded" xmlns:chart="nativescript-telerik-ui-pro/chart"> <chart:RadCartesianChart id="cartesianChart"> <chart:RadCartesianChart.series> <chart:BarSeries.horizontalAxis> <chart:CategoricalAxis/> </chart:BarSeries.horizontalAxis> <chart:BarSeries.verticalAxis> <chart:LinearAxis minimum="-10" maximum="25"/> </chart:BarSeries.verticalAxis> <chart:BarSeries items="{{ countriesSource }}" categoryProperty="Country" valueProperty="Amount" /> <chart:LineSeries items="{{ yearSource }}" categoryProperty="Country" valueProperty="SecondVal" /> </chart:RadCartesianChart.series> </chart:RadCartesianChart></Page>page.js
"use strict";var observable_1 = require("data/observable");// our first data modelvar countriesItems = [ { Country: "Germany", Amount: -5, SecondVal: 14 }, { Country: "France", Amount: 13, SecondVal: -3 }, { Country: "Bulgaria", Amount: -10, SecondVal: 17 }, { Country: "Spain", Amount: 11, SecondVal: -9 }, { Country: "USA", Amount: 18, SecondVal: 8 }];// our second data modelvar yearItems = [ { Year: 200, Amount: 15 }, { Year: 456, Amount: -8 }, { Year: 366, Amount: 25 }, { Year: 100, Amount: -5 }, { Year: 340, Amount: 17 }, { Year: 135, Amount: 20 },];var viewModel = new observable_1.Observable();// bind both models to the properties that we will use in xmlviewModel.set("countriesSource", countriesItems);viewModel.set("yearSource", countriesItems);function navigatingTo(args) { var page = args.object; page.bindingContext = viewModel; // bnid the whole model to the chart page}exports.navigatingTo = navigatingTo;Note the following line in our xml file
<chart:BarSeries items="{{ countriesSource }}"
categoryProperty="Country"
valueProperty="Amount" />What is happening here is that we re saying :
- from our page.bindingContext take the model for countriesSource
- from items in countriesSource (the binded countriesItems) use the values for "Country" key to generate our categories
- from items in countriesSource (the binded countriesItems) use the values for "Amount" key to generate the bar values
Same applies to the next line chart (notice that there we are also using "country" key for categories so our
two charts will share a common categories - of course yu can create totally different business logic)
I hope that will give you some insight of what you can do with charts - there are multiple variations that can be created and used. If you are interested here is another basic example with buble-charts and three different source : http://docs.telerik.com/devtools/nativescript-ui/Controls/NativeScript/Chart/Series/bubble
Regards,
Nikolay Iliev
Telerik
When i try to run my app on ios
sh-3.2# tns run ios --device 7ac469275096a086b208d9408bff51aad65d47a5
Your application will be deployed only on the device specified by the provided index or identifier.
Project successfully prepared
Build settings from command line:
ARCHS = armv7
CONFIGURATION_BUILD_DIR = /Users/neoito/Desktop/NativeScriptStudy/TestIos/platforms/ios/build/device
SDKROOT = iphoneos8.2
SHARED_PRECOMPS_DIR = /Users/neoito/Desktop/NativeScriptStudy/TestIos/platforms/ios/build/sharedpch
VALID_ARCHS = armv7
=== BUILD TARGET TestIos OF PROJECT TestIos WITH CONFIGURATION Debug ===
Check dependencies
Code Sign error: No code signing identities found: No valid signing identities (i.e. certificate and private key pair) matching the team ID “(null)” were found.
CodeSign error: code signing is required for product type 'Application' in SDK 'iOS 8.2'
** BUILD FAILED **
The following build commands failed:
Check dependencies
(1 failure)
Command xcodebuild failed with exit code 65
# run ios
┌──────────────────────────────┬───────────────────────────────────────────┐
│ Usage │ Synopsis │
│ Run on all connected devices │ $ tns run ios [--release] [--justlaunch] │
│ Run on a selected connected │ $ tns run ios [--device <Device ID>] [- │
│ device │ -release] [--justlaunch] │
│ Start an emulator and run │ $ tns run ios --emulator [<Emulator │
│ the app inside it │ Options>] [--release] │
└──────────────────────────────┴───────────────────────────────────────────┘
Runs your project on a connected iOS device or in the iOS Simulator, if configured. This is shorthand for prepare, build, and deploy. While your app is running, prints the output from the application in the console.
IMPORTANT: Before building for iOS device, verify that you have configured a valid pair of certificate and provisioning profile on your OS X system.
### Options
* --device - Specifies a connected device on which to run the app.
* --emulator - If set, runs the app in a native emulator for the target platform, if configured. When set, you can also set any other valid combination of emulator options as listed by $ tns help emulate ios. You cannot use --device and --emulator simultaneously.
* --release - If set, produces a release build. Otherwise, produces a debug build.
* --justlaunch - If set, does not print the application output in the console.
### Attributes
* <Device ID> is the index or name of the target device as listed by $ tns device ios
* <Emulator Options> is any valid combination of options as listed by $ tns help emulate ios
Sending exception report (press Ctrl+C to stop)......
how can i fix this error?
This error is caused because you can only deploy and run apps if you have Developer ID and configured certificates and provisioning profiles associated with your account and Apple device. Otherwise you can only build apps on the simulator.
To build your app for an iOS device, you must configure a valid certificate and provisioning profile pair, and have that pair present on your system for code signing your application package.
A full walktrhough on that matter can be found here : http://seventhsoulmountain.kripajay.com/2013/09/ios-code-sign-in-complete-walkthrough.html
Note that the Apple Developer Program is paid service and the price for individuals started at 99 US dollars (for one-year membership).
Regards,
Nikolay Iliev
Telerik
Hai,
Now i am started working on ios when i create a new project it is runing nicely in ios but i have a another my own project but that one is not running ios... when i add ios platform in command promt no error but when i come on platform ios not copying all xml,css,js one way i can say like this my total project is not copying Why it happening can you help me..?
In my understanding at your own project you are running
tns platform add ios and from that point your project is not running..
Based on the information about how you are coping your project keep in mind
that if you try to copy/paste content from Windows PC to MAC computer the differences in the way their
text redactor work may cause unreadable files.
To avoid that use source control system like https://github.com/
However can you please provide more information about this line from your original message "not copying all xml,css,js one way i can say like this my total project is not copying ". Platform add will not copy any file - it will add ios platform folder in your app structure ( under app/platforms/ios ) and will allow tns run ios to prepare, build and start your app under iOS simulator (or device). The files in your ./app will remain the same and will be used to generate your app content and logic for both Android and iOS.
Regards,
Nikolay Iliev
Telerik
Hi, Nikolay Iliev
Thanks for your support i am still working on Nativescript chart now i am facing some problem,
1. In chart page i need to add ScrollView
2. In a xml full page after a chart i need to write some contents and need to add slider arrows (that means in footer position)
3. My page style like this
Fisrt part header, second i need to write sone sentence after chart next like footer part some contents and slider arrow.
how will i do this?
When using ScrollView keep ni mind that it should "know" the sizes of its child elements which will it will scroll.
That means that you can not set abstract sizes like auto or * (for Grid rows and col) and should avoid using percentages for sizing child elements.
For example how to implement scroll-view with header section, chart and footer section.
in your page.xml
<Page xmlns="http://schemas.nativescript.org/tns.xsd" navigatingTo="navigatingTo" loaded="onPageLoaded" xmlns:chart="nativescript-telerik-ui-pro/chart"> <ScrollView > <GridLayout rows="50, 400, 50" columns="*"> <GridLayout row="0" rows="*" columns="*" backgroundColor="green"> <Label text="Header" textWrap="true" /> </GridLayout> <chart:RadCartesianChart row="1" id="cartesianChart"> <chart:RadCartesianChart.series> <chart:BarSeries.horizontalAxis> <chart:CategoricalAxis/> </chart:BarSeries.horizontalAxis> <chart:BarSeries.verticalAxis> <chart:LinearAxis minimum="-10" maximum="25"/> </chart:BarSeries.verticalAxis> <chart:BarSeries items="{{ countriesSource }}" categoryProperty="Country" valueProperty="Amount" /> <chart:LineSeries items="{{ yearSource }}" categoryProperty="Country" valueProperty="SecondVal" /> </chart:RadCartesianChart.series> </chart:RadCartesianChart> <GridLayout row="2" rows="*" columns="*" backgroundColor="blue"> <Label text="Footer" textWrap="true" /> </GridLayout> </GridLayout> </ScrollView></Page>in your page.js
"use strict"; var observable_1 = require("data/observable"); var countriesItems = [ { Country: "Germany", Amount: -5, SecondVal: 14 }, { Country: "France", Amount: 13, SecondVal: -3 }, { Country: "Bulgaria", Amount: -10, SecondVal: 17 }, { Country: "Spain", Amount: 11, SecondVal: -9 }, { Country: "USA", Amount: 18, SecondVal: 8 } ]; var yearItems = [ { Year: 200, Amount: 15 }, { Year: 456, Amount: -8 }, { Year: 366, Amount: 25 }, { Year: 100, Amount: -5 }, { Year: 340, Amount: 17 }, { Year: 135, Amount: 20 }, ]; var viewModel = new observable_1.Observable(); viewModel.set("countriesSource", countriesItems); viewModel.set("yearSource", countriesItems); function navigatingTo(args) { var page = args.object; page.bindingContext = viewModel;} exports.navigatingTo = navigatingTo; In the code above if you change the dimensions of your main GridLayout
from this:
<GridLayout rows="50, 400, 50" columns="*">to this:
<GridLayout rows="50, *, 50" columns="*">From this point on the slider arrows should be easily implemented once you have your footer - there are plenty examples for creating ones - either with custom images or with custom buttons with background images or even with iconFonts
Regards,
Nikolay Iliev
Telerik
Hi,
This code is working now.
after i put a slide plugin (nativescript-slides) in android it is working properly but in ios slide is working but this graph is became small
my code is
<ScrollView>
<GridLayout rows="50, 400, 50" columns="*">
<GridLayout row="0" rows="*" columns="*" backgroundColor="green">
<Label text="Header" textWrap="true" />
</GridLayout>
<GridLayout row="1">
<Slides:SlideContainer id="slideContainer" loop="true" >
<Slides:Slide>
<chart:RadCartesianChart row="1" id="cartesianChart">
<chart:RadCartesianChart.series>
<chart:BarSeries.horizontalAxis>
<chart:CategoricalAxis/>
</chart:BarSeries.horizontalAxis>
<chart:BarSeries.verticalAxis>
<chart:LinearAxis minimum="-10" maximum="25"/>
</chart:BarSeries.verticalAxis>
<chart:BarSeries items="{{ countriesSource }}" categoryProperty="Country" valueProperty="Amount" />
<chart:LineSeries items="{{ yearSource }}" categoryProperty="Country" valueProperty="SecondVal" />
</chart:RadCartesianChart.series>
</chart:RadCartesianChart>
</Slides:Slide>
<Slides:Slide>
</Slides:Slide>
<Slides:Slide>
</Slides:Slide>
</Slides:SlideContainer>
</GridLayout>
<GridLayout row="2" rows="*,*" columns="*" backgroundColor="#fff">
<StackLayout row="0" col="0" orientation="horizontal" horizontalAlignment="center" style="margin-top:10;">
<Image src="~/images/left.png" tap="prev" cssClass="arrowLeft" />
<StackLayout orientation="vertical" horizontalAlignment="center">
<Label text=" 2ND QUARTER - 015" cssClass="slideLabel" />
</StackLayout>
<Image src="~/images/right.png" tap="next" cssClass="arrowRight" />
</StackLayout>
</GridLayout>
</GridLayout>
</ScrollView>
I have researched your code and the reason why your chart is not displaying correctly is because the plugin -slides is using AbsoluteLayout to create each slide. By default, the behaviour of absolute elements with no predefined sizes is different in iOS and Android and this is the reason for the different result.
However the solution is pretty simple - you just need to give a size for your charts (or whatever parent container you are going to use in your different slides)
In your case change this line of code
<chart:RadCartesianChart id="cartesianChart" >With this line
<chart:RadCartesianChart id="cartesianChart" height="400">Both iOS and Android seems to handle well width but still if it is applicable you might want to set it as well.
Regards,
Nikolay Iliev
Telerik
By "scroll touch " I am understanding the swipe gesture to change the different slides - if my understanding is correct then it is working on both Android and iOS for the sample project. Just keep in mind that you have to make several swipes for passing over the empty slides in your code sample (or create other charts to test it with content)
Regards,
Nikolay Iliev
Telerik
Hi,
In chart i need to change color in bar chart then in ios also should be same which i used in android now the colours changing in ios and android...
i did design in android but the same design in ios is not looking good.. can i do separate page for ios
To have a different UX in Android and iOS you can use platform qualifiers to specify different files for usage under different OS and screen resolutions.
For example, you can have:
page.ios.css (higher priority then page.css)
page.android.css (higher priority then page.css)
page.css (common styling which will be valid for both OS)
And your styles will load accordingly to the operating system loaded.
Full documentation article about this option you can find here.
Also, you can specify different screen pages,(more about this option here).
Specifically, for "--pro" you can further style your charts with properties like
strokeColor, fillColor, strokeWidth (more about this you can find here)
Regards,
Nikolay Iliev
Telerik
hi,
Can i set rotation in disable mode?
i did this code
<Page xmlns="http://schemas.nativescript.org/tns.xsd"
navigatingTo="navigatingTo"
loaded="onPageLoaded"
xmlns:chart="nativescript-telerik-ui-pro/chart">
<ScrollView >
<GridLayout rows="50, 400, 50" columns="*">
<GridLayout row="0" rows="*" columns="*"backgroundColor="green">
<Label text="Header" textWrap="true" />
</GridLayout>
<chart:RadCartesianChart row="1" id="cartesianChart">
<chart:RadCartesianChart.series>
<chart:BarSeries.horizontalAxis>
<chart:CategoricalAxis/>
</chart:BarSeries.horizontalAxis>
<chart:BarSeries.verticalAxis>
<chart:LinearAxis minimum="-10"maximum="25"/>
</chart:BarSeries.verticalAxis>
<chart:BarSeries items="{{ countriesSource }}"categoryProperty="Country" valueProperty="Amount" />
<chart:LineSeries items="{{ yearSource }}"categoryProperty="Country" valueProperty="SecondVal" />
</chart:RadCartesianChart.series>
</chart:RadCartesianChart>
<GridLayout row="2" rows="*" columns="*"backgroundColor="blue">
<Label text="Footer" textWrap="true" />
</GridLayout>
</GridLayout>
</ScrollView>
</Page>
but here when i touch on chart section scrollview is not working but it is working end of the right part of chart screen, i need scroll view swipe selection entire screen or full chart i need scroll view on touch or swipe.
another one question
exports.chartNext = function() {
var topmost = frameModule.topmost();
topmost.navigate("./views/chart/chartSecond");
};
i did this code for navigate one page to another page in ios it is working very well but in android some version it is not working like lollipop. Why?
is that any update problem or else?
I have tested the scenario you have described and on my side, the chart is scrollable and works as expected.
Can you specify on what platform you are testing (OS, API Level, emulator/device)
About your second question - you should "cache" your topmost when your page is loaded or navigatedTo.
For example
var frameModule = require("ui/frame");var topmost;function navigatingTo(args) { var page = args.object; topmost = frameModule.topmost();}exports.navigatingTo = navigatingTo;function goToSubPage() { topmost.navigate("sub-page");}exports.goToSubPage = goToSubPage;I have tested it on 4 different API version and it works perfectly.
Regards,
Nikolay Iliev
Telerik
J
When I run my app showing this error how can solve this error?
Java.lang.RuntimeException: Unable to start activity ComponentInfo{org.nativescript.MyApp/com.tns.NativeScriptActivity}: com.tns.NativeScriptException:
Calling js method onCreate failed
TypeError: Cannot read property 'ContentLayout' of undefined
File: "/data/data/org.nativescript.MyApp/files/app/tns_modules/ui/frame/frame.js, line: 221, column: 47
StackTrace:
Frame: function:'Frame._createUI', file:'/data/data/org.nativescript.MyApp/files/app/tns_modules/ui/frame/frame.js', line: 221, column: 48
Frame: function:'View._onContextChanged', file:'/data/data/org.nativescript.MyApp/files/app/tns_modules/ui/core/view.js', line: 209, column: 14
Frame: function:'View._onAttached', file:'/data/data/org.nativescript.MyApp/files/app/tns_modules/ui/core/view.js', line: 165, column: 14
Frame: function:'NativeScriptActivity.onCreate', file:'/data/data/org.nativescript.MyApp/files/app/tns_modules/ui/frame/frame.js', line: 613, column: 18
at android.app.ActivityThread.performLaunchActivity(ActivityThread.java:2329)
at android.app.ActivityThread.handleLaunchActivity(ActivityThread.java:2389)
at android.app.ActivityThread.access$900(ActivityThread.java:147)
at android.app.ActivityThread$H.handleMessage(ActivityThread.java:1296)
at android.os.Handler.dispatchMessage(Handler.java:102)
at android.os.Looper.loop(Looper.java:135)
at android.app.ActivityThread.main(ActivityThread.java:5254)
at java.lang.reflect.Method.invoke(Native Method)
at java.lang.reflect.Method.invoke(Method.java:372)
at com.android.internal.os.ZygoteInit$MethodAndArgsCaller.run(ZygoteInit.java:898)
at com.android.internal.os.ZygoteInit.main(ZygoteInit.java:693)
Caused by: com.tns.NativeScriptException:
Calling js method onCreate failed
TypeError: Cannot read property 'ContentLayout' of undefined
File: "/data/data/org.nativescript.MyApp/files/app/tns_modules/ui/frame/frame.js, line: 221, column: 47
StackTrace:
Frame: function:'Frame._createUI', file:'/data/data/org.nativescript.MyApp/files/app/tns_modules/ui/frame/frame.js', line: 221, column: 48
Frame: function:'View._onContextChanged', file:'/data/data/org.nativescript.MyApp/files/app/tns_modules/ui/core/view.js', line: 209, column: 14
Frame: function:'View._onAttached', file:'/data/data/org.nativescript.MyApp/files/app/tns_modules/ui/core/view.js', line: 165, column: 14
Frame: function:'NativeScriptActivity.onCreate', file:'/data/data/org.nativescript.MyApp/files/app/tns_modules/ui/frame/frame.js', line: 613, column: 18
at com.tns.Runtime.callJSMethodNative(Native Method)
at com.tns.Runtime.dispatchCallJSMethodNative(Runtime.java:861)
at com.tns.Runtime.callJSMethodImpl(Runtime.java:726)
at com.tns.Runtime.callJSMethod(Runtime.java:712)
at com.tns.Runtime.callJSMethod(Runtime.java:693)
at com.tns.Runtime.callJSMethod(Runtime.java:683)
at com.tns.NativeScriptActivity.onCreate(NativeScriptActivity.java:13)
at android.app.Activity.performCreate(Activity.java:5933)
at android.app.Instrumentation.callActivityOnCreate(Instrumentation.java:1105)
at android.app.ActivityThread.performLaunchActivity(
There are several possibilities for the cause of this error message.
As I do not have the project that invokes that behaviour I can not reproduce it but still there
are some steps you can try to resolve it.
Remove the platforms folder - manually or with the following commands. The idea is to reset your gradle file
and all cached files
tns platform remove androidtns platform remove iostns platform add androidAnd then rebuild your app. with
tns run androidHowever if this does not resolve your issue let us know what version of NativeScript you are experiencing it,(possible solution is upgrading to the latest core and modules following )
Also, provide some code base or sample project with which you are throwing the error and the used node.js and Android SDK versions. Is this your working project or a new one - if this is the project you are working on: have you added some new plugins or specific code that can be responsible for the error.
Regards,
Nikolay Iliev
Telerik
iTunes Store operation failed.
No suitable application records were found. Verify your bundle identifier 'org.nativescript.MyApp' is correct.
i tried to upload my nativescript app in appstore but this error is showing.. how can i upload my app in mac itunes.. can you give more explanation for this.... step by step..
An extended step-by-step tutorial for publishing in iOS you can find at the following link: https://docs.nativescript.org/core-concepts/publishing-ios-apps#publishing-a-nativescript-ios-app-in-the-app-store
In this article, you will find information that you need to set, modify and provide in order to have successfully published your application in Apple App Store.The last section of this article is about enrolling in iTunes Connect.
I recommend going through the whole material as there are many mandatory requirements from Apple that needs to be fulfilled.
As a side note with our next release (version the workflow for providing the mandatory AppIcons and LaunchScreen (images or storyboards) will be simplified and an additional article on that matter will be released as well.
After reading the introduction you can also check our CLI workflow for publishing in iOS from the following link: https://www.nativescript.org/blog/details/tip-using-nativescript-cli-to-publish-an-app-in-the-ios-app-store
Regards,
Nikolay Iliev
Telerik
ERROR ITMS-90096: "Your binary is not optimized for iPhone 5 - New iPhone apps and app updates submitted must support the 4-inch display on iPhone 5 and must include a launch image referenced in the Info.plist under UILaunchImages with a UILaunchImageSize value set to {320, 568}. Launch images must be PNG files and located at the top-level of your bundle, or provided within each .lproj folder if you localize your launch images. Learn more about iPhone 5 support and app launch images by reviewing the 'iOS Human Interface Guidelines' at 'https://developer.apple.com/library/ios/documentation/UserExperience/Conceptual/MobileHIG/IconsImages/IconsImages.html#//apple_ref/doc/uid/TP40006556-CH14-SW5' and the 'iOS App Programming Guide' at 'https://developer.apple.com/library/ios/documentation/iPhone/Conceptual/iPhoneOSProgrammingGuide/App-RelatedResources/App-RelatedResources.html#//apple_ref/doc/uid/TP40007072-CH6-SW12'."
ERROR ITMS-90096: "Your binary is not optimized for iPhone 5 - New iPhone apps and app updates submitted must support the 4-inch display on iPhone 5 and must include a launch image referenced in the Info.plist under UILaunchImages with a UILaunchImageSize value set to {320, 568}. Launch images must be PNG files and located at the top-level of your bundle, or provided within each .lproj folder if you localize your launch images. Learn more about iPhone 5 support and app launch images by reviewing the 'iOS Human Interface Guidelines' at 'https://developer.apple.com/library/ios/documentation/UserExperience/Conceptual/MobileHIG/IconsImages/IconsImages.html#//apple_ref/doc/uid/TP40006556-CH14-SW5' and the 'iOS App Programming Guide' at 'https://developer.apple.com/library/ios/documentation/iPhone/Conceptual/iPhoneOSProgrammingGuide/App-RelatedResources/App-RelatedResources.html#//apple_ref/doc/uid/TP40007072-CH6-SW12'."
When i run in ios showing this error how to fix this..?
Thank you for reporting your problem.
I have made a little research and found that this issue could be caused due to incorrect image format for launch image or not providing support for all iPhone 5 screens. In regard to that I found several discussions, which could help you to resolve your problem:
http://stackoverflow.com/questions/23780432/xcode-error-while-validation-your-binary-is-not-optimized-for-iphone-5
http://www.appcoda.com/how-to-add-splash-screen-in-your-ios-app/
https://github.com/Simbul/baker/issues/1201
you could also review this article, where have been described how to Creating AppIcons and Launch Screens for iOS for your NativeScript project.
I hope this information would be useful. I will be glad to assist you further.
Regards,
nikolay.tsonev
Telerik
hi,
In PieSeries chart can i change each pie in different colour my own color...
how will do?
Yes, you can customize each pie entry with your own fillColor, strokeColor and strokeWidth.
Here is an example syntax on how to customize each PaletteEntry (including the colors of the selected state)
<chart:RadPieChart row="1" selectionMode="Single" margin="20"> <chart:RadPieChart.series> <chart:PieSeries seriesName="Pie" showLabels="true" selectionMode="DataPoint" expandRadius="0.1" outerRadiusFactor="0.8" items="{{ pieSource }}" valueProperty="Amount" legendLabel="Country"> <chart:PieSeries.labelStyle> <chart:PointLabelStyle margin="-55" textFormat="%2.0f%%" textColor="White" textSize="10" /> </chart:PieSeries.labelStyle> </chart:PieSeries> </chart:RadPieChart.series> <chart:RadPieChart.legend> <chart:RadLegendView position="Top" title="" height="70"/> </chart:RadPieChart.legend> <chart:RadCartesianChart.palettes> <chart:Palette seriesName="Pie"> <chart:Palette.entries> <chart:PaletteEntry fillColor="#08caab" strokeWidth="0" /> <chart:PaletteEntry fillColor="#026968" strokeWidth="0" /> <chart:PaletteEntry fillColor="#aee403" strokeWidth="0" /> <chart:PaletteEntry fillColor="#3c5afe" strokeWidth="0" /> </chart:Palette.entries> </chart:Palette> --> <chart:Palette seriesName="Pie" seriesState="Selected"> <chart:Palette.entries> <chart:PaletteEntry fillColor="#08caab" strokeWidth="2" strokeColor="#026555" /> <chart:PaletteEntry fillColor="#026968" strokeWidth="2" strokeColor="#003434" /> <chart:PaletteEntry fillColor="#aee403" strokeWidth="2" strokeColor="#577202"/> <chart:PaletteEntry fillColor="#3c5afe" strokeWidth="2" strokeColor="#1e2d7f" /> </chart:Palette.entries> </chart:Palette> </chart:RadCartesianChart.palettes> </chart:RadPieChart>The full example for this case ca be found at the following link:
https://github.com/NativeScript/nativescript-marketplace-demo
Note that at this very moment, the demo above is optimized for iOS - Android optimization coming soon.
Regards,
Nikolay Iliev
Telerik by Progress
CONSOLE ERROR file:///app/tns_modules/trace/trace.js:160:30: Binding: Binding error while setting property items of BarSeries: ReferenceError: Can't find variable: TKChartSeriesSelection
this error showing in ios
but same chart working in android? how can i fix this
Can you please share the sample project or code that is throwing that error in order to reproduce it locally.
Regards,
Nikolay Iliev
Telerik by Progress
.DS_Storebossapp
sh-3.2# tns create BossAppDemo
Project BossAppDemo was successfully created.
sh-3.2# cd BossAppDemo/
sh-3.2# tns run ios
Copying template files...
Project successfully created.
Cannot read property 'id' of undefined
# run ios
┌──────────────────────────────┬───────────────────────────────────────────┐
│ Usage │ Synopsis │
│ Run on all connected devices │ $ tns run ios [--release] [--justlaunch] │
│ Run on a selected connected │ $ tns run ios [--device <Device ID>] [- │
│ device │ -release] [--justlaunch] │
│ Start an emulator and run │ $ tns run ios --emulator [<Emulator │
│ the app inside it │ Options>] [--release] │
└──────────────────────────────┴───────────────────────────────────────────┘
Runs your project on a connected iOS device or in the iOS Simulator, if configured. This is shorthand for prepare, build, and deploy. While your app is running, prints the output from the application in the console.
IMPORTANT: Before building for iOS device, verify that you have configured a valid pair of certificate and provisioning profile on your OS X system.
### Options
* --device - Specifies a connected device on which to run the app.
* --emulator - If set, runs the app in a native emulator for the target platform, if configured. When set, you can also set any other valid combination of emulator options as listed by $ tns help emulate ios. You cannot use --device and --emulator simultaneously.
* --release - If set, produces a release build. Otherwise, produces a debug build.
* --justlaunch - If set, does not print the application output in the console.
### Attributes
* <Device ID> is the index or name of the target device as listed by $ tns device ios
* <Emulator Options> is any valid combination of options as listed by $ tns help emulate ios
Sending exception report (press Ctrl+C to stop).....
sh-3.2#
In ios Showing this error but this same new created app running in android
How can i solve this error?
Based on your error log it seems that you are trying to run your app on a connected device for which you do not have provisioning profile set.
https://docs.nativescript.org/core-concepts/publishing-ios-apps#certificates-identifiers--profiles
Without provisioning profile, you can run your apps on simulator only.
To do that either disconnect your iOS device, start your simulator and run
run ios
or use
run ios --emulator
Regards,
Nikolay Iliev
Telerik by Progress
You can debug your app via the CLI or via VSCode.
To learn more about the debug options and requirements please refer to this
documentation article: https://docs.nativescript.org/core-concepts/debugging.html#debugging-with-visual-studio-code
Also here you can find a nice video tutorial from a known NativeScript community
And at this link, you can find the NativeScript youtube channel introduction for debugging in nativeScript.
Regards,
Nikolay Iliev
Telerik by Progress
Hai,
when i run my code in ios showing this error how can fix it.?
CONSOLE ERROR file:///app/tns_modules/trace/trace.js:160:30: Binding: Binding error while setting property items of BarSeries: ReferenceError: Can't find variable: TKChartSeriesSelection
My xml is here
<Page loaded="pageLoaded"
navigatingTo="navigatingTo"
xmlns:dd="nativescript-drop-down"
xmlns:chart="nativescript-telerik-ui-pro/chart"
xmlns:Slides="nativescript-slides" actionBarHidden="true">
<!-- <ActionBar>
<ActionBar.titleView>
<NavigationButton visibility="collapsed"/>
<GridLayout columns="auto, auto" rows="*,*" cssClass="header">
<Image src="~/images/logo_tagline.png" col="0" row="0" horizontalAlignment="left" verticalAlignment="center" cssClass="logo"/>
<Image src="~/images/profile_picture.png" col="1" row="0" horizontalAlignment="right" verticalAlignment="center" cssClass="profilePic" />
</GridLayout>
</ActionBar.titleView>
</ActionBar> -->
<ScrollView>
<GridLayout rows="180, 410, 100" columns="*">
<GridLayout rows="*, *,*" columns="*, *, *, *" orientation="vertical">
<GridLayout row="0" col="0" colSpan="4" height="70">
<Image src="~/images/logo_tagline.png" horizontalAlignment="left" verticalAlignment="center" cssClass="logo" />
<Image src="~/images/profile_picture.png" horizontalAlignment="right" verticalAlignment="center" cssClass="profilePic" tap="pieChart" />
</GridLayout>
<GridLayout row="1" col="0" colSpan="4" style.backgroundColor="#9E3293" height="50">
<Label width="70%" text="Accounts Profit and Loss Statement" cssClass="textCenter" horizontalAlignment="left" verticalAlignment="center" />
<GridLayout width="30%" height="40" style.backgroundColor="#CDCDCD" horizontalAlignment="right" verticalAlignment="center" cssClass="dropDown">
<dd:DropDown items="{{ items }}" selectedIndex="{{ selectedIndex }}" cssClass="dropIcon"/>
</GridLayout>
</GridLayout>
<GridLayout row="2" col="0" colSpan="4">
<StackLayout style.backgroundColor="#BDBDBD" cssClass="dropDownlength">
<dd:DropDown items="{{ cash }}" selectedIndex="{{ selectedIndex }}" cssClass="dropDetails"/>
</StackLayout>
</GridLayout>
</GridLayout>
<GridLayout row="1" height="500">
<Slides:SlideContainer id="slideContainer" loop="true" height="400">
<Slides:Slide height="500">
<chart:RadCartesianChart id="chart" selectionMode="Single" height="500">
<chart:RadCartesianChart.series>
<chart:BarSeries seriesName="Bar1" categoryProperty="name" items="{{ info.chartSource1 }}" valueProperty="ExpenseDirect" selectionMode="Series" stackMode="Stack" showLabels="true" />
<chart:BarSeries seriesName="Bar" items="{{ info.chartSource1 }}" valueProperty="ExpenseExceptDirect" selectionMode="Series" stackMode="Stack" categoryProperty="name" showLabels="true" />
<chart:BarSeries seriesName="Bar2" valueProperty="netProfit" items="{{ info.chartSource1 }}" selectionMode="Series" stackMode="Stack" categoryProperty="name" showLabels="true" />
</chart:RadCartesianChart.series>
<chart:RadCartesianChart.horizontalAxis>
<chart:CategoricalAxis labelTextColor="#cb4b16" labelSize="10" lineThickness="2" lineColor="Red" />
</chart:RadCartesianChart.horizontalAxis>
<chart:RadCartesianChart.verticalAxis>
<chart:LinearAxis labelTextColor="Green" lineThickness="2" lineColor="Red" />
</chart:RadCartesianChart.verticalAxis>
<chart:RadCartesianChart.grid>
<chart:RadCartesianChartGrid
horizontalLinesVisible="true"
verticalLinesVisible="false"
verticalStripLinesVisible="false"
horizontalStrokeColor="#e5e5e5"
verticalStripLineColor="#00000000, #00000000"
horizontalStripLineColor="#f8f8f8, #00000000"/>
</chart:RadCartesianChart.grid>
<chart:RadCartesianChart.palettes>
<chart:Palette seriesName="Bar">
<chart:Palette.entries>
<chart:PaletteEntry fillColor="#F37122" strokeWidth="0" android:strokeColor="#F37122" />
</chart:Palette.entries>
</chart:Palette>
<chart:Palette seriesName="Bar1">
<chart:Palette.entries>
<chart:PaletteEntry fillColor="#9E3293" strokeWidth="0" android:strokeColor="#9E3293" />
</chart:Palette.entries>
</chart:Palette>
<chart:Palette seriesName="Bar2">
<chart:Palette.entries>
<chart:PaletteEntry fillColor="#616161" strokeWidth="0" android:strokeColor="#616161" />
</chart:Palette.entries>
</chart:Palette>
</chart:RadCartesianChart.palettes>
</chart:RadCartesianChart>
</Slides:Slide>
<Slides:Slide>
<chart:RadCartesianChart id="chart" selectionMode="Single" height="500">
<chart:RadCartesianChart.series>
<chart:BarSeries seriesName="Bar1" categoryProperty="name" items="{{ source.chartSource2 }}" valueProperty="ExpenseDirect" selectionMode="Series" stackMode="Stack" showLabels="true" />
<chart:BarSeries seriesName="Bar" items="{{ source.chartSource2 }}" valueProperty="ExpenseExceptDirect" selectionMode="Series" stackMode="Stack" categoryProperty="name" showLabels="true" />
<chart:BarSeries seriesName="Bar2" valueProperty="netProfit" items="{{ source.chartSource2 }}" selectionMode="Series" stackMode="Stack" categoryProperty="name" showLabels="true" />
</chart:RadCartesianChart.series>
<chart:RadCartesianChart.horizontalAxis>
<chart:CategoricalAxis labelTextColor="#cb4b16" labelSize="10" lineThickness="2" lineColor="Red" />
</chart:RadCartesianChart.horizontalAxis>
<chart:RadCartesianChart.verticalAxis>
<chart:LinearAxis labelTextColor="Green" lineThickness="2" lineColor="Red" />
</chart:RadCartesianChart.verticalAxis>
<chart:RadCartesianChart.grid>
<chart:RadCartesianChartGrid
horizontalLinesVisible="true"
verticalLinesVisible="false"
verticalStripLinesVisible="false"
horizontalStrokeColor="#e5e5e5"
verticalStripLineColor="#00000000, #00000000"
horizontalStripLineColor="#f8f8f8, #00000000"/>
</chart:RadCartesianChart.grid>
<chart:RadCartesianChart.palettes>
<chart:Palette seriesName="Bar">
<chart:Palette.entries>
<chart:PaletteEntry fillColor="#F37122" strokeWidth="0" android:strokeColor="#F37122" />
</chart:Palette.entries>
</chart:Palette>
<chart:Palette seriesName="Bar1">
<chart:Palette.entries>
<chart:PaletteEntry fillColor="#9E3293" strokeWidth="0" android:strokeColor="#9E3293" />
</chart:Palette.entries>
</chart:Palette>
<chart:Palette seriesName="Bar2">
<chart:Palette.entries>
<chart:PaletteEntry fillColor="#616161" strokeWidth="0" android:strokeColor="#616161" />
</chart:Palette.entries>
</chart:Palette>
</chart:RadCartesianChart.palettes>
</chart:RadCartesianChart>
</Slides:Slide>
<Slides:Slide>
<chart:RadCartesianChart id="chart" selectionMode="Single" height="500">
<chart:RadCartesianChart.series>
<chart:BarSeries seriesName="Bar1" categoryProperty="name" items="{{ chart3.chartSource3 }}" valueProperty="ExpenseDirect" selectionMode="Series" stackMode="Stack" showLabels="true" />
<chart:BarSeries seriesName="Bar" items="{{ chart3.chartSource3 }}" valueProperty="ExpenseExceptDirect" selectionMode="Series" stackMode="Stack" categoryProperty="name" showLabels="true" />
<chart:BarSeries seriesName="Bar2" valueProperty="netProfit" items="{{ chart3.chartSource3 }}" selectionMode="Series" stackMode="Stack" categoryProperty="name" showLabels="true" />
</chart:RadCartesianChart.series>
<chart:RadCartesianChart.horizontalAxis>
<chart:CategoricalAxis labelTextColor="#cb4b16" labelSize="10" lineThickness="2" lineColor="Red" />
</chart:RadCartesianChart.horizontalAxis>
<chart:RadCartesianChart.verticalAxis>
<chart:LinearAxis labelTextColor="Green" lineThickness="2" lineColor="Red" />
</chart:RadCartesianChart.verticalAxis>
<chart:RadCartesianChart.grid>
<chart:RadCartesianChartGrid
horizontalLinesVisible="true"
verticalLinesVisible="false"
verticalStripLinesVisible="false"
horizontalStrokeColor="#e5e5e5"
verticalStripLineColor="#00000000, #00000000"
horizontalStripLineColor="#f8f8f8, #00000000"/>
</chart:RadCartesianChart.grid>
<chart:RadCartesianChart.palettes>
<chart:Palette seriesName="Bar">
<chart:Palette.entries>
<chart:PaletteEntry fillColor="#F37122" strokeWidth="0" android:strokeColor="#F37122" />
</chart:Palette.entries>
</chart:Palette>
<chart:Palette seriesName="Bar1">
<chart:Palette.entries>
<chart:PaletteEntry fillColor="#9E3293" strokeWidth="0" android:strokeColor="#9E3293" />
</chart:Palette.entries>
</chart:Palette>
<chart:Palette seriesName="Bar2">
<chart:Palette.entries>
<chart:PaletteEntry fillColor="#616161" strokeWidth="0" android:strokeColor="#616161" />
</chart:Palette.entries>
</chart:Palette>
</chart:RadCartesianChart.palettes>
</chart:RadCartesianChart>
</Slides:Slide>
<Slides:Slide>
<chart:RadCartesianChart id="chart" selectionMode="Single" height="500">
<chart:RadCartesianChart.series>
<chart:BarSeries seriesName="Bar1" categoryProperty="name" items="{{ chart4.chartSource4 }}" valueProperty="ExpenseDirect" selectionMode="Series" stackMode="Stack" showLabels="true" />
<chart:BarSeries seriesName="Bar" items="{{ chart4.chartSource4 }}" valueProperty="ExpenseExceptDirect" selectionMode="Series" stackMode="Stack" categoryProperty="name" showLabels="true" />
<chart:BarSeries seriesName="Bar2" valueProperty="netProfit" items="{{ chart4.chartSource4 }}" selectionMode="Series" stackMode="Stack" categoryProperty="name" showLabels="true" />
</chart:RadCartesianChart.series>
<chart:RadCartesianChart.horizontalAxis>
<chart:CategoricalAxis labelTextColor="#cb4b16" labelSize="10" lineThickness="2" lineColor="Red" />
</chart:RadCartesianChart.horizontalAxis>
<chart:RadCartesianChart.verticalAxis>
<chart:LinearAxis labelTextColor="Green" lineThickness="2" lineColor="Red" />
</chart:RadCartesianChart.verticalAxis>
<chart:RadCartesianChart.grid>
<chart:RadCartesianChartGrid
horizontalLinesVisible="true"
verticalLinesVisible="false"
verticalStripLinesVisible="false"
horizontalStrokeColor="#e5e5e5"
verticalStripLineColor="#00000000, #00000000"
horizontalStripLineColor="#f8f8f8, #00000000"/>
</chart:RadCartesianChart.grid>
<chart:RadCartesianChart.palettes>
<chart:Palette seriesName="Bar">
<chart:Palette.entries>
<chart:PaletteEntry fillColor="#F37122" strokeWidth="0" android:strokeColor="#F37122" />
</chart:Palette.entries>
</chart:Palette>
<chart:Palette seriesName="Bar1">
<chart:Palette.entries>
<chart:PaletteEntry fillColor="#9E3293" strokeWidth="0" android:strokeColor="#9E3293" />
</chart:Palette.entries>
</chart:Palette>
<chart:Palette seriesName="Bar2">
<chart:Palette.entries>
<chart:PaletteEntry fillColor="#616161" strokeWidth="0" android:strokeColor="#616161" />
</chart:Palette.entries>
</chart:Palette>
</chart:RadCartesianChart.palettes>
</chart:RadCartesianChart>
</Slides:Slide>
</Slides:SlideContainer>
</GridLayout>
<GridLayout row="2" rows="*,*" columns="*,*,*" backgroundColor="#fff">
<StackLayout row="0" colSpan="3" col="0" orientation="horizontal" horizontalAlignment="center" style="margin-top:10;">
<Image src="~/images/left.png" tap="prev" cssClass="arrowLeft" />
<!-- <Button tap="prev" text="prev" class="btnMain" /> -->
<StackLayout orientation="vertical" horizontalAlignment="center">
<Label text=" 2ND QUARTER - 015" cssClass="slideLabel" />
</StackLayout>
<Image src="~/images/right.png" tap="next" cssClass="arrowRight" />
</StackLayout>
<StackLayout row="1" col="0" orientation="horizontal" cssClass="containerCalender">
<Label text="" cssClass="colorBox" />
<Label text="Accounts Receiveables" cssClass="ChartColor" verticalAlignment="center" />
</StackLayout>
<StackLayout row="1" col="1" orientation="horizontal" cssClass="containerCalender">
<Label text="" cssClass="colorBox1" />
<Label text="Accounts Payables" cssClass="ChartColor" verticalAlignment="center" />
</StackLayout>
<StackLayout row="1" col="2" orientation="horizontal" cssClass="containerCalender">
<Label text="" cssClass="colorBox2" />
<Label text="Cumulative Net Cash" cssClass="ChartColor" verticalAlignment="center" />
</StackLayout>
</GridLayout>
</GridLayout>
</ScrollView>
</Page>
my Js here
var frameModule = require("ui/frame");
var scrollViewModule = require("ui/scroll-view");
var observableArray = require("data/observable-array");
var observable = require("data/observable");
var scrollView = new scrollViewModule.ScrollView();
var http = require("http");
var viewModel;
var slideContainer;
function pageLoaded(args) {
var page = args.object;
slideContainer = page.getViewById('slideContainer');
// console.log(slideContainer);
var items = new observableArray.ObservableArray();
var cash = new observableArray.ObservableArray();
viewModel = new observable.Observable();
items.push('Menu','About','About');
cash.push('Income','Cash Flow From Operations','Operations1','Operations2');
console.log(cash);
viewModel.set("cash", cash);
viewModel.set("items", items);
viewModel.set("selectedIndex", 1);
page.bindingContext = viewModel;
}
exports.pageLoaded = pageLoaded;
exports.loaded = function(eventData) {
page = eventData.object;
page.bindingContext = pageData;
};
exports.pieChart = function() {
var topmost = frameModule.topmost();
topmost.navigate("views/file/pieChart");
};
function next(args) {
console.log('Next slide');
slideContainer.nextSlide();
}
exports.next = next;
function prev(args) {
console.log('Previous slide');
slideContainer.previousSlide();
}
exports.prev = prev;
var observable_1 = require("data/observable");
var file_system_1 = require("file-system");
var page;
function navigatingTo(args) {
// var page = args.object;
// var observable = new observable_1.Observable();
// var documents = file_system_1.knownFolders.currentApp();
// var jsonFile = documents.getFile('shared/chart.json');
// var jsonData;
// jsonFile.readText()
// .then(function (content) {
// jsonData = JSON.parse(content);
// // console.log(content);
// // console.dump(jsonData);
// observable.set("info", jsonData);
// }, function (error) {
// throw new Error('Could not read JSON file');
// });
// page.bindingContext = observable;
var jsonData;
var page = args.object;
var observable = new observable_1.Observable();
var documents = file_system_1.knownFolders.currentApp();
http.request({
url: "http://bossapp-erp.activbm.com/",
method: "POST",
headers: { "Content-Type": "application/x-www-form-urlencoded" },
content: 'cmd=login&usr=Administrator&pwd=bossapp123'
}).then(function (response) {
sidCookie = response.headers['Set-Cookie'][0].split(";")[0]
url = 'http://bossapp-erp.activbm.com/?report_name=Profit+and+Loss+Statement&filters=%7B%22company%22%3A%22Bluesky+Group+Pte.+Ltd.%22%2C%22fiscal_year%22%3A%222016%22%2C%22periodicity%22%3A%22Monthly%22%7D&cmd=frappe.desk.query_report.run&_=1467792072302'
http.request({
url: url,
method: "GET",
headers: { "sid": sidCookie }
}).then(function (response) {
var year = 2016
result = response.content.toJSON().message
var responseResult = response.content.toJSON().message.result
chartArry1 = []
chartArry2 = []
chartArry3 = []
chartArry4 = []
var chartSource1 = {}
var chartSource2 = {}
var chartSource3 = {}
var chartSource4 = {}
var gObj = {}
var p // current parent
for (var i = 0; i < responseResult.length; i++) {
// console.log("Came 2 newObj")
var c = responseResult[i] // current Node
if (c.parent_account == null && c.account != null) {
p = c.account.replace(/[\. ,:-]+/g, "-") // parent node
gObj[p] = c
} else if (c.parent_account != null) {
var p1 = c.parent_account.replace(/[\. ,:-]+/g, "-") // parent node
var ch = c.account.replace(/[\. ,:-]+/g, "-") // child node
if(gObj[p1]) {
gObj[p1]['child'] = gObj[p1]['child'] || {}
gObj[p1]['child'][ch] = c
}
else {
if(gObj[p]['child'][p1]){
gObj[p]['child'][p1]['child'] = gObj[p]['child'][p1]['child'] || {}
gObj[p]['child'][p1]['child'][ch] = c
}
}
}
else if(c.account == null){
if(c.account_name == "'Net Profit / Loss'"){
gObj["total"] = c
}
}
}
var janExpenseDirect = gObj["Expenses-BSG"]["child"]["Expenses-Direct-BSG"]["jan_"+year]
var febExpenseDirect = gObj["Expenses-BSG"]["child"]["Expenses-Direct-BSG"]["feb_"+year]
var marExpenseDirect = gObj["Expenses-BSG"]["child"]["Expenses-Direct-BSG"]["mar_"+year]
var aprExpenseDirect = gObj["Expenses-BSG"]["child"]["Expenses-Direct-BSG"]["apr_"+year]
var mayExpenseDirect = gObj["Expenses-BSG"]["child"]["Expenses-Direct-BSG"]["may_"+year]
var junExpenseDirect = gObj["Expenses-BSG"]["child"]["Expenses-Direct-BSG"]["jun_"+year]
var julExpenseDirect = gObj["Expenses-BSG"]["child"]["Expenses-Direct-BSG"]["jul_"+year]
var augExpenseDirect = gObj["Expenses-BSG"]["child"]["Expenses-Direct-BSG"]["aug_"+year]
var sepExpenseDirect = gObj["Expenses-BSG"]["child"]["Expenses-Direct-BSG"]["sep_"+year]
var octExpenseDirect = gObj["Expenses-BSG"]["child"]["Expenses-Direct-BSG"]["oct_"+year]
var novExpenseDirect = gObj["Expenses-BSG"]["child"]["Expenses-Direct-BSG"]["nov_"+year]
var decExpenseDirect = gObj["Expenses-BSG"]["child"]["Expenses-Direct-BSG"]["dec_"+year]
var janExpenseExceptDirect = gObj["Expenses-BSG"]["child"]["Expenses-Operating-BSG"]["jan_"+year] + gObj["Expenses-BSG"]["child"]["Expenses-Staff-BSG"]["jan_"+year]
var febExpenseExceptDirect = gObj["Expenses-BSG"]["child"]["Expenses-Operating-BSG"]["feb_"+year] + gObj["Expenses-BSG"]["child"]["Expenses-Staff-BSG"]["feb_"+year]
var marExpenseExceptDirect = gObj["Expenses-BSG"]["child"]["Expenses-Operating-BSG"]["mar_"+year] + gObj["Expenses-BSG"]["child"]["Expenses-Staff-BSG"]["mar_"+year]
var aprExpenseExceptDirect = gObj["Expenses-BSG"]["child"]["Expenses-Operating-BSG"]["apr_"+year] + gObj["Expenses-BSG"]["child"]["Expenses-Staff-BSG"]["apr_"+year]
var mayExpenseExceptDirect = gObj["Expenses-BSG"]["child"]["Expenses-Operating-BSG"]["may_"+year] + gObj["Expenses-BSG"]["child"]["Expenses-Staff-BSG"]["may_"+year]
var junExpenseExceptDirect = gObj["Expenses-BSG"]["child"]["Expenses-Operating-BSG"]["jun_"+year] + gObj["Expenses-BSG"]["child"]["Expenses-Staff-BSG"]["jun_"+year]
var julExpenseExceptDirect = gObj["Expenses-BSG"]["child"]["Expenses-Operating-BSG"]["jul_"+year] + gObj["Expenses-BSG"]["child"]["Expenses-Staff-BSG"]["jul_"+year]
var augExpenseExceptDirect = gObj["Expenses-BSG"]["child"]["Expenses-Operating-BSG"]["aug_"+year] + gObj["Expenses-BSG"]["child"]["Expenses-Staff-BSG"]["aug_"+year]
var sepExpenseExceptDirect = gObj["Expenses-BSG"]["child"]["Expenses-Operating-BSG"]["sep_"+year] + gObj["Expenses-BSG"]["child"]["Expenses-Staff-BSG"]["sep_"+year]
var octExpenseExceptDirect = gObj["Expenses-BSG"]["child"]["Expenses-Operating-BSG"]["oct_"+year] + gObj["Expenses-BSG"]["child"]["Expenses-Staff-BSG"]["oct_"+year]
var novExpenseExceptDirect = gObj["Expenses-BSG"]["child"]["Expenses-Operating-BSG"]["nov_"+year] + gObj["Expenses-BSG"]["child"]["Expenses-Staff-BSG"]["nov_"+year]
var decExpenseExceptDirect = gObj["Expenses-BSG"]["child"]["Expenses-Operating-BSG"]["dec_"+year] + gObj["Expenses-BSG"]["child"]["Expenses-Staff-BSG"]["dec_"+year]
var janNetProfit = gObj["total"]["jan_"+year]
var febNetProfit = gObj["total"]["feb_"+year]
var marNetProfit = gObj["total"]["mar_"+year]
var aprNetProfit = gObj["total"]["apr_"+year]
var mayNetProfit = gObj["total"]["may_"+year]
var junNetProfit = gObj["total"]["jun_"+year]
var julNetProfit = gObj["total"]["jul_"+year]
var augNetProfit = gObj["total"]["aug_"+year]
var sepNetProfit = gObj["total"]["sep_"+year]
var octNetProfit = gObj["total"]["oct_"+year]
var novNetProfit = gObj["total"]["nov_"+year]
var decNetProfit = gObj["total"]["dec_"+year]
janObj = {name : "January",ExpenseDirect : janExpenseDirect,ExpenseExceptDirect : janExpenseExceptDirect, netProfit : 0 }
febObj = {name : "February",ExpenseDirect : febExpenseDirect,ExpenseExceptDirect : febExpenseExceptDirect, netProfit : febNetProfit }
marObj = {name : "March",ExpenseDirect : marExpenseDirect,ExpenseExceptDirect : marExpenseExceptDirect, netProfit : marNetProfit }
aprObj = {name : "April",ExpenseDirect : aprExpenseDirect,ExpenseExceptDirect : aprExpenseExceptDirect, netProfit : aprNetProfit }
mayObj = {name : "May",ExpenseDirect : mayExpenseDirect,ExpenseExceptDirect : mayExpenseExceptDirect, netProfit : mayNetProfit }
junObj = {name : "June",ExpenseDirect : junExpenseDirect,ExpenseExceptDirect : junExpenseExceptDirect, netProfit : junNetProfit }
julObj = {name : "July",ExpenseDirect : julExpenseDirect,ExpenseExceptDirect : julExpenseExceptDirect, netProfit : julNetProfit }
augObj = {name : "August",ExpenseDirect : augExpenseDirect,ExpenseExceptDirect : augExpenseExceptDirect, netProfit : augNetProfit }
sepObj = {name : "September",ExpenseDirect : sepExpenseDirect,ExpenseExceptDirect : sepExpenseExceptDirect, netProfit : sepNetProfit }
octObj = {name : "October",ExpenseDirect : octExpenseDirect,ExpenseExceptDirect : octExpenseExceptDirect, netProfit : octNetProfit }
novObj = {name : "November",ExpenseDirect : novExpenseDirect,ExpenseExceptDirect : novExpenseExceptDirect, netProfit : novNetProfit }
decObj = {name : "December",ExpenseDirect : decExpenseDirect,ExpenseExceptDirect : decExpenseExceptDirect, netProfit : decNetProfit }
chartArry1.push(janObj)
chartArry1.push(febObj)
chartArry1.push(marObj)
chartArry2.push(aprObj)
chartArry2.push(mayObj)
chartArry2.push(junObj)
chartArry3.push(julObj)
chartArry3.push(augObj)
chartArry3.push(sepObj)
chartArry4.push(octObj)
chartArry4.push(novObj)
chartArry4.push(decObj)
chartSource1["chartSource1"] = chartArry1
// console.log("HAI")
observable.set("info", chartSource1);
page.bindingContext = observable;
chartSource2["chartSource2"] = chartArry2
// console.log("paul")
observable.set("source", chartSource2);
page.bindingContext = observable;
chartSource3["chartSource3"] = chartArry3
// console.log("neoito")
observable.set("chart3", chartSource3);
page.bindingContext = observable;
chartSource4["chartSource4"] = chartArry4
console.log("sura")
observable.set("chart4", chartSource4);
page.bindingContext = observable;
// observable.set("info", jsonData);
}, function (e) {
console.log("Error occurred " + e);
});
}, function (e) {
console.log("Error occurred " + e);
});
}
exports.navigatingTo = navigatingTo;
1. in ios center of this graph scrolling touch is not working but right of this graph scrolling touch is working very well
2. in center of this graph slide swipe also not working but right of this graph swipe is working very well
this all problems only in ios android it is working same code
Can you please clarify which version of the iOS platform you are using? You can see the version of the framework files your project's platforms folder.
We made some changes to the native chart selection and now nativescript uses these changes. If the run-time can't resolve the new API it means there is a mismatch between the javascript run-time and the native iOS run-time.
Regards,
Victor
Telerik by Progress
{
"nativescript": {
"id": "org.nativescript.bossapp",
"tns-android": {
"version": "2.1.1"
},
"tns-ios": {
"version": "2.1.1"
}
},
"dependencies": {
"nativescript-drop-down": "^1.2.5",
"nativescript-slides": "^1.7.0",
"nativescript-telerik-ui-pro": "^1.1.1",
"tns-core-modules": "2.0.1"
},
"devDependencies": {
"babel-traverse": "6.10.4",
"babel-types": "6.11.1",
"babylon": "6.8.4",
"lazy": "1.0.11"
}
}
these are the versions... which i am using now
In order to use the latest version of "--pro" controls you can execute the following steps:
- remove the old version of the plugin with
plugin removes ---pro
- add the latest version with
plugin ---pro
Now after opening your package.json you "--pro" version should be 1.2.0 which will apply the latest changes and your error regarding TKChartSelection should be resolved.
As for your following question regarding the swi[e not working inside the chart graph you can use userInteractionEnabled to enable.disable the user interaction with the charts so that there would be no conflicts with events that triggered nested controls (in your case the chart and its parent Slides and ScrollView).
Example solution for this problem is discussed here.
What you need to do is to get the reference to your chart and set userInteractionEnabled to false.
myChart.userInteractionEnabled = false;
However, I noticed some potential problems regarding your code architecture.
1.) You have several charts with exact same ID. Each ID in your page should have unique value and use same ID will lead to unexpected behaviour.
So your chars can not have all id="chart"
They should have unique IDs (e.g. "chart-one", "chart-two", etc..)
2.) You have several nested controls using the same gestures.You have wrapped everything in ScrollView (which uses swipe gestures to scroll up and down) then you are using the Slides plugin which creates slides which are also using swipe gestures (left and right0 and finally without myChart.userInteractionEnabled = false; myChart.userInteractionEnabled = false; the charts are also using gestures to interact with users.
You should think about a simpler structure or to remove your gestures conflict by disabling some of them.
Regards,
Nikolay Iliev
Telerik by Progress
Hi,
when clicking on a button, i am adding a component in the page :
var greeter = builder.load({
path: 'views/file',
name: 'pieChart'
});
container.addChild(greeter);
on the component page i am adding "<StackLayout
xmlns:chart="nativescript-telerik-ui-pro/chart"
xmlns:Slides="nativescript-slides"
loaded="onLoad">"
<StackLayout>
the logic is written in onLoad.The code is working fine in android but is having showing error when deploying to ios.
2016-07-11 20:09:19.384 BossAppDemo[6727:2111331] -[NSNull x]: unrecognized selector sent to instance 0x3b527310
2016-07-11 20:09:19.431 BossAppDemo[6727:2111331] *** JavaScript call stack:
(
0 UIApplicationMain@[native code]
1 start@file:///app/tns_modules/application/application.js:233:26
2 @file:///app/app.js:18:30
3 promiseReactionJob@:1:11
)
2016-07-11 20:09:19.432 BossAppDemo[6727:2111331] *** Terminating app due to uncaught exception 'NSInvalidArgumentException', reason: '-[NSNull x]: unrecognized selector sent to instance 0x3b527310'
*** First throw call stack:
(0x24cef91b 0x2448ae17 0x24cf52b5 0x24cf2ee1 0x24c1e238 0xb62077 0xbcae47 0xb8aed7 0xb6116f 0xbc8ba1 0xb625c3 0xbc8e29 0x27316101 0x27409771 0x273154d1 0x272f9561 0x272f9221 0x272f86e1 0x272f83b5 0x29267851 0x24cb1dff 0x24cb19ed 0x24cafd5b 0x24bff229 0x24bff015 0x261efac9 0x292d1189 0x91702c 0x913959 0x5034b7 0x7510ab 0x74ee61 0x756c7d 0x756c89 0x756c89 0x751ab1 0x7112d5 0x6fa241 0x7f4143 0x844ab9 0x508f0b 0x53b15b 0x710a1 0x248a7873)
libc++abi.dylib: terminating with uncaught exception of type NSException
Hi,
Dropdown on change is not working for me.I have tried to copy the angular code for onchange which is also not working for me now.The code :
XML:
<dd:DropDown id="dd" items="{{ items }}" hint="{{ hint }}" selectedIndex="{{ selectedIndex }}" selectedIndexChange="onchange(dd.selectedIndex)" />
JS:
exports.onchange = function(selectedi){
console.log("selected index");
}
We will need a whole project to reproduce and test your scenario.
However when loading components dynamically you can follow this article.
Here are the basic steps
1.) your custom component
<!-- app/components/greeter/greeter.xml --><StackLayout loaded="onLoad"> <Label id="fL"/> <Label id="nL"/></StackLayout>/* app/components/greeter/greeter.js */exports.onLoad = args => { const container = args.object; const frameworkLabel = container.getViewById('fL'); const nameLabel = container.getViewById('nL'); frameworkLabel.text = `Hello ${container.framework || 'Nativescript'}`; nameLabel.text = `My name is ${container.name.first} ${container.name.last}`;};2.) in your main page
<!-- app/main-page.xml --><Page xmlns="http://schemas.nativescript.org/tns.xsd"navigatingTo="onNavigatingTo"> <StackLayout id="container"> </StackLayout> </Page>/* app/main-page.js */const builder = require('ui/builder');exports.onNavigatingTo = args => { const page = args.object; const myName = { first: 'Akash', last: 'Agrawal' }; const container = page.getViewById('container'); const greeter = builder.load({ path: 'components/greeter', name: 'greeter' }); container.addChild(greeter); greeter.framework = 'angular-nativescript'; greeter.name = myName;};If you need further assistance on loading custom components dynamically please send us sample project and as much information as possible in order to test and reproduce it locally.
p.p. For your question about NativeScript-drop-down plugin you can log an issue at the author's GitHub repository at the following link: https://github.com/PeterStaev/NativeScript-Drop-Down as this is a third party plugin developed by a community member and can be from the author.
.
However, there are few tips you should consider and check for your app.
1.) The namespace declaration should be present for the plugin
<Page xmlns="http://schemas.nativescript.org/tns.xsd" loaded="pageLoaded" xmlns:dd="nativescript-drop-down">2.) In the sample used a view model is passed here (TypeScript code)
import observable = require("data/observable");import observableArray = require("data/observable-array");import pages = require("ui/page");var viewModel: observable.Observable;export function pageLoaded(args: observable.EventData) { var page = <pages.Page>args.object; var items = new observableArray.ObservableArray(); viewModel = new observable.Observable(); for (var loop = 0; loop < 200; loop++) { items.push("Item " + loop.toString()); } viewModel.set("items", items); viewModel.set("hint", "My Hint"); viewModel.set("selectedIndex", 15); page.bindingContext = viewModel;}Still, I can not find implementation of selectedIndexChange
in the authors code.
Regards,
Nikolay Iliev
Telerik by Progress
Hi,
In nativescript telerik-ui-pro bar chart when there is no value in x and y axis the graph is populated..... see image
Hi,
<chart:BarSeries seriesName="Bar1" items="{{ source.chartSource2 }}" valueProperty="ExpenseDirect" showLabels="true" categoryProperty="name" stackMode="Stack" />
<chart:BarSeries seriesName="Bar" items="{{ source.chartSource2 }}" valueProperty="ExpenseExceptDirect" showLabels="true" categoryProperty="name" stackMode="Stack" />
<chart:BarSeries seriesName="Bar2" items="{{ source.chartSource2 }}" valueProperty="netProfit" showLabels="true" categoryProperty="name" stackMode="Stack" />
When i set stack mode as stack value is zero it's showing filled chart but when i remove stack mode stack it's showing value zero.
In order for your graph not to be populated when there are no values set for your valueProperry
you should explicitly set your minimum and maximum values of your axis and in the you can set your values to 0 via your data context.
For example:
Let;s say that for demonstration purposes you are using the code from this article: http://docs.telerik.com/devtools/nativescript-ui/Controls/NativeScript/Chart/Series/bar
In order yo have your chart empty set the following:
your data (set the valueProperty for all entries to 0)
get categoricalSource() { return [ { Country: "Germany", Amount: 0 }, { Country: "France", Amount: 0 }, { Country: "Bulgaria", Amount: 0 }, { Country: "Spain", Amount: 0 }, { Country: "USA", Amount: 0 } ]}in your XML file with the chart
<chart:LinearAxis minimum="20" maximum="100"/>The result is:
Regards,
Nikolay Iliev
Telerik by Progress
Hi,
i want to populate bar chart with stack where the key for the amount will be coming dynamically.currently i was working with charts where we can give the value property static in xml.how to set the name dynamically...
json structure like this..
{
"chartSource": [
{"name":"April","Dresses":100000,"Pants":200000,"Top":300000,"Skirts":400000,"Jackets":500000},
{"name":"May","Dresses":10000,"Pants":200000,"Top":30000,"Skirts":400000,"Jackets":500000},
{"name":"June","Dresses":35000,"Pants":25000,"Top":255500,"Skirts":35000,"Jackets":254000},
{"name":"July","Dresses":258361,"Pants":20000,"Top":300000,"Skirts":25000,"Jackets":35620}
]
}
this is only for your understanding json i have api which providing data dynamically now json value only five which i mention but sometimes it may 10 value i need to call that value in dynamically model to my bay chart stackMode Stack..
my xml like this..
<chart:RadCartesianChart id="chart" selectionMode="Single"
chart.userInteractionEnabled = "false" height="400" showLabels="false">
<chart:RadCartesianChart.series>
<chart:BarSeries
seriesName="Bar"
categoryProperty="name"
items="{{ info.chartSource }}"
valueProperty="Top"
selectionMode="Series"
stackMode="Stack"
showLabels="false" />
<chart:BarSeries
seriesName="Bar4"
items="{{ info.chartSource }}"
valueProperty="Jackets"
selectionMode="Series"
stackMode="Stack"
categoryProperty="name"
showLabels="false" />
<chart:BarSeries
seriesName="Bar4"
valueProperty="Pants"
items="{{ info.chartSource }}"
selectionMode="Series"
stackMode="Stack"
categoryProperty="name"
showLabels="false" />
<chart:BarSeries
seriesName="Bar3"
items="{{ info.chartSource }}"
valueProperty="Skirts"
selectionMode="Series"
stackMode="Stack"
categoryProperty="name"
showLabels="false" />
<chart:BarSeries
seriesName="Bar2"
valueProperty="Top"
items="{{ info.chartSource }}"
selectionMode="Series"
stackMode="Stack"
categoryProperty="name"
showLabels="false" />
</chart:RadCartesianChart.series>
<chart:RadCartesianChart.horizontalAxis>
<chart:CategoricalAxis
labelTextColor="#cb4b16"
labelSize="10"
lineThickness="2"
lineColor="Red" />
</chart:RadCartesianChart.horizontalAxis>
<chart:RadCartesianChart.verticalAxis>
<chart:LinearAxis labelTextColor="Green" lineThickness="2" lineColor="Red" />
</chart:RadCartesianChart.verticalAxis>
<chart:RadCartesianChart.grid>
<chart:RadCartesianChartGrid
horizontalLinesVisible="true"
verticalLinesVisible="false"
verticalStripLinesVisible="false"
horizontalStrokeColor="#e5e5e5"
verticalStripLineColor="#00000000, #00000000"
horizontalStripLineColor="#f8f8f8, #00000000"/>
</chart:RadCartesianChart.grid>
<chart:RadCartesianChart.palettes>
<chart:Palette seriesName="Bar">
<chart:Palette.entries>
<chart:PaletteEntry fillColor="#D3FF4F" strokeWidth="0" android:strokeColor="#D3FF4F" />
</chart:Palette.entries>
</chart:Palette>
<chart:Palette seriesName="Bar1">
<chart:Palette.entries>
<chart:PaletteEntry fillColor="#36BBFF" strokeWidth="0" android:strokeColor="#36BBFF" />
</chart:Palette.entries>
</chart:Palette>
<chart:Palette seriesName="Bar2">
<chart:Palette.entries>
<chart:PaletteEntry fillColor="#FFF200" strokeWidth="0" android:strokeColor="#FFF200" />
</chart:Palette.entries>
</chart:Palette>
<chart:Palette seriesName="Bar3">
<chart:Palette.entries>
<chart:PaletteEntry fillColor="#F44336" strokeWidth="0" android:strokeColor="#F44336" />
</chart:Palette.entries>
</chart:Palette>
<chart:Palette seriesName="Bar4">
<chart:Palette.entries>
<chart:PaletteEntry fillColor="#FF0395" strokeWidth="0" android:strokeColor="#FF0395" />
</chart:Palette.entries>
</chart:Palette>
</chart:RadCartesianChart.palettes>
</chart:RadCartesianChart>
that (valueProperty="Top" ) i need to call dynamic.. i can't mention each value because data coming from api.
<chart:BarSeries
seriesName="Bar"
categoryProperty="name"
items="{{ info.chartSource }}"
valueProperty="Top"
selectionMode="Series"
stackMode="Stack"
showLabels="false" />
this all data should be dynamic..
Can you help me?
What you need to do is to implement synchronization to your mobile application.
In order to sync data between your app and your server, there are many approaches and techniques
but they ar all out of the NativeScript scope so perhaps your question will find better suggestions in SO community or similar developers communities.
To get better understanding of the problem you are trying to solve please refer to the following sources:
nice discussion for the concept behind sync in Android apps
http://stackoverflow.com/questions/10829371/sync-data-between-android-app-and-webserver
Simple sync technique for mobile apps using Couchbase-lite
https://infinum.co/the-capsized-eight/articles/server-client-syncing-for-mobile-apps-using-couchbase-mobile
And what will work for you - thisSNativescript plugin for using CoachbaseDB for syncing your data.
https://github.com/couchbaselabs/nativescript-couchbase
What is happening with the Couchbase plugin is basically the following:
var couchbaseModule = require("nativescript-couchbase");database = new couchbaseModule.Couchbase("test-database");var push = database.createPushReplication("http://sync-gateway-host:4984/test-database");var pull = database.createPullReplication("http://sync-gateway-host:4984/test-database");push.setContinuous(true);pull.setContinuous(true);push.start();pull.start();// set the changeListener for your dbdatabase.addDatabaseChangeListener(function(changes) { for(var i = 0; i < changes.length; i++) { console.log(changes[i].getDocumentId()); }});For more understanding, you can refer to the author's demo app here
Regards,
Nikolay Iliev
Telerik by Progress
Hi,
1) I am working on bar chart where i want to remove the y axis along with value.I have tried with lineHidden="true" where the line is getting hidden but value showing and once i change the text color to white there is empty space.Attaching the Screen shot:
2) Also is there any way create custom label on bar charts and also to add label inside the charts,Attaching screen shot: sample 1
3) The line series in the image sample (sample1.png) when added in my app is not overriding the bar.Is there a way to override the line chart in bar series.
code sample:
<chart:RadCartesianChart.series>
<chart:LineSeries seriesName="Line" items="{{ info.chartSource1 }}" categoryProperty="name" valueProperty="netProfit" selectionMode="" showLabels="true" />
<chart:BarSeries
seriesName="Bar"
items="{{ info.chartSource1 }}"
valueProperty="ExpenseDirect"
selectionMode="Series"
stackMode="Stack"
categoryProperty="name"
showLabels="true" />
<chart:BarSeries
seriesName="Bar1"
categoryProperty="name"
items="{{ info.chartSource1 }}"
valueProperty="ExpenseOther"
selectionMode="Series"
stackMode="Stack"
showLabels="true" />
<chart:BarSeries
seriesName="Bar2"
valueProperty="directIncome"
items="{{ info.chartSource1 }}"
selectionMode="Series"
stackMode="Stack"
categoryProperty="name"
showLabels="true" />
</chart:RadCartesianChart.series>
1) You can simply apply a negative margin to the left side of the chart to simulate a missing Y axis.
2) You may want to take a look at the label styling documentation articles:
http://docs.telerik.com/devtools/nativescript-ui/Controls/NativeScript/Chart/Labels/styling
Applying custom labels in the bars might be implemented by putting a separate Label element over the Chart in the XML definition of your {N} page.
3) I am not quite sure that I correctly understand this question. Could you please provide some more details on the "line series overriding the bar" requirement?
Regards,
Deyan
Telerik by Progress
Hi,
1. i removed line using lineHidden="true" now i need remove value also see picture below: image ...38
2. this line should be over the bar chart :- image ...36 see below
Hi,
I loading charts inside a slider container.So each slide will have a sperate id.when i load the page i want load the slide which i prefer dynamically.i tried with passing the slide id(<Slides:Slide id="quater4"> ) in :
slideContainer.startSlideshow("quater4") and slideContainer.nextSlide("quater4"); which is not working.is there any way to the slider by Id
I am guessing that you are using -slides plugin which is developed by nativeScript community members.So in order to get the best recommendations the best place to seek the answer is in the author's repository issue section.
I had also researched the provided API references for this plugin and noticed that you have functionalities for using nextSlide() and previousSlide()
Also, I have noticed that there is already an opened issue with feature request goToSlide(index) which was
discussed two weeks ago and the authors have this in mind. Here is the specific issue which you may track for additional information about this code implementation and time spans.
In fact, the author this: Hey thanks for the feedback, I'm currently working 2.0 version and will make sure to include that.
Regards,
Nikolay Iliev
Telerik by Progress
Hi,
Is it possible to add label inside bar of a bar chart with stack mode:
Image Attached.
Yes, you can add and style a label for Bar chart series.
For example:
<chart:BarSeries items="{{ firstSeries }}" showLabels="true" stackMode="Stack" categoryProperty="name" valueProperty="Pants"></chart:BarSeries>showLabels="true"You can further customize your labels for each series using the following syntax:
<chart:BarSeries items="{{ firstSeries }}" showLabels="true" stackMode="Stack" categoryProperty="name" valueProperty="Dresses"> <chart:BarSeries.labelStyle> <chart:PointLabelStyle margin="10" fontStyle="Bold" fillColor="#FC6060" textSize="10" textColor="White" /> </chart:BarSeries.labelStyle></chart:BarSeries>The documentation article about styling labels can be found at the following link: http://docs.telerik.com/devtools/nativescript-ui/Controls/NativeScript/Chart/Labels/styling
Regards,
Nikolay Iliev
Telerik by Progress
Hi Nikolay,
I am having this normal label working fine but.is it possible to add custom label to the chart as there are situation in the charts value when the stack will be having less value and the labels will be overlapping.
Image attached.
Also i am having a issues which i need help:
1) I want to remove the y axis line of the chart so. i removed line using lineHidden="true" property now i need remove value also is it possible see
picture below:yaxisShowing.png
2)In the second image (netprofitNotOverapping.png) the black line has to overlap the green bar chart.which is not happening.
image:netprofitNotOverapping.png
Regarding the label question: You should probably apply different styles in order to customize the label as it fits your app needs.
There are plenty of options for customizing your label
fillColor: the point label background fill colorstrokeColor: the color of the label strokemargin: the margin of labeltextFormat: the string used as a formatting string for label value. This format must comply with IEEE SpecificationtextColor: the label font colortextSize: the size of label fontfontName: the font name. If it is missing from the OS the default font is used instead.fontStyle: specify the style of font. Bold , Italic , BoldItalic and Normal values can be used. Defaults to Normal
Regarding question 1.)
As the colleague Deyan has suggested you can apply a negative margin to your chart.
<chart:RadCartesianChart id="cartesianChart" class="negative-margin">.negative-margin { margin-left: -50;}Regarding question 2.)
Simply change the place of your chart.LineSeries in your XML file to be below the green BarSeries. (or below any charts you want to render behind the line)
For example:
<chart:BarSeries items="{{ firstSeries }}" showLabels="true" stackMode="Stack" categoryProperty="name" valueProperty="Pants"></chart:BarSeries><chart:BarSeries items="{{ firstSeries }}" showLabels="true" stackMode="Stack" categoryProperty="name" valueProperty="Jackets"></chart:BarSeries><chart:LineSeries seriesName="Line" items="{{ firstSeries }}" categoryProperty="name" valueProperty="Skirts" showLabels="true" />Regards,
Nikolay Iliev
Telerik by Progress
Hi,
I am having an xml page with <StackLayout xmlns:chart="nativescript-telerik-ui-pro/chart" loaded="pageLoaded" > .
i am having a button when clicked i need the content of the of stackLayout to be changed and new data should be coming by binding to UI.
inside the button tap function i am binding the data which is not getting refected in the UI
How to bind data from another function to the UI.
sample code:
<StackLayout orientation="vertical" row="auto,auto" column="*" id="chartContainer">
<StackLayout row="1" col="0" orientation="horizontal" horizontalAlignment="center" style="margin-top:10;">
<Button text="" tap="prev" class="material-icon btnSlide" fontSize="22" />
<StackLayout orientation="vertical" horizontalAlignment="center">
<Label text="{{sliderFooter}}" cssClass="slideLabel" />
</StackLayout>
<Button text="" tap="next" class="material-icon btnSlide" fontSize="22" />
</StackLayout>
</StackLayout>
JS:
function pageLoaded(args) {
page = args.object;
var observable = new observable_1.Observable();
var documents = file_system_1.knownFolders.currentApp();
observable.set("sliderFooter", "week2")
page.bindingContext = observable;
}
function next(args) {
var observable = new observable_1.Observable();
page = args.object;
observable.set("sliderFooter", "week3")
page.bindingContext = observable;
}
exports.next = next;
Looking through your code sample I must point out a few things;
1.) StackLayout does not have rows and cols (those attributes are used with Grid Layout).. if you have a gridLayout as a parent then you can set rows and cols and then use row and col to specify on which row and col in the GridLayout to have your inner element displayed. Notice the difference - declaring Grid's rows and cols VS declaring the place of the element within the grid with row nad col
2.) About your binding context.
- You are creating your binding context in two places and overriding it. That is not good practice and will also cause for you to lose the initial data after overwriting the context.
What you can do is called lazy loading - create your viewModel and reuse it in your page the following way.
"use strict";var observable_1 = require("data/observable");var viewModel = new observable_1.Observable();viewModel.set("sliderFooter", "week2"); // initial value for your sliderFooterfunction navigatingTo(args) { var page = args.object; page.bindingContext = viewModel;}exports.navigatingTo = navigatingTo;function next(args) { // you don't have to get reference to your page here.. // you don't have to create new context and overwirte the old one // just set the new value to the already defined property viewModel.set("sliderFooter", "week300");}exports.next = next;
<Page xmlns="http://schemas.nativescript.org/tns.xsd" navigatingTo="navigatingTo"> <StackLayout> <Button text="" tap="prev" fontSize="22" /> <StackLayout> <Label text="{{sliderFooter}}" /> </StackLayout> <Button text="" tap="next" /> </StackLayout></Page>Now that you have set your page binding context in navigatingTo (or other events such as loaded) just make sure have exported your methods and bind to the property and exported methods
Regards,
Nikolay Iliev
Telerik by Progress
Hi Nikolay,
1.When figures for 2 bars are too close, the bar labels will overlap each other. Can i set place the labels to the right/left side to prevent the overlapping. See Image 2016-07-23 19.18.33.png
2. Can i set height dynamically according to screen dimension. now ui looking not good. see image 20-07-23 19.20.02.png
3. i tired to change labels background color change and text color change my code like this:-
<chart:BarSeries
seriesName="Bar1"
categoryProperty="name"
items="{{ source.chartSource2 }}"
valueProperty="ExpenseOther"
selectionMode="Series"
stackMode="Stack"
showLabels="true">
<chart:LineSeries.labelStyle>
<chart:PointLabelStyle margin="10" fontStyle="Bold" fillColor="#000" textSize="10" textColor="#fff" />
</chart:LineSeries.labelStyle>
</chart:BarSeries>
this code is not working still i am getting default bg colour and text colour but margin="10" fontStyle="Bold" textSize="10" this style are working. see image 2016-07-23 19.30.09.png
Regarding question 1.)
Currently, the styling properties supported for your labels are as follows:
fillColor: the point label background fill colorstrokeColor: the color of the label strokemargin: the margin of labeltextFormat: the string used as a formatting string for label value. This format must comply with IEEE SpecificationtextColor: the label font colortextSize: the size of label fontfontName: the font name. If it is missing from the OS the default font is used instead.fontStyle: specify the style of font. Bold , Italic , BoldItalic and Normal values can be used. Defaults to Normal
Regarding question 2.)
Based on the assumption that you are using NativeScript core (and not angular-2) the best approach for providing responsible UI is to use the platform-specific files and develop your layouts based on the different screen dimensions.Full article on that matter can be found at this link.
Regarding question 3.)
Indeed, after some local tests, it seems that the fillColor and textColor properties are currently working only under iOS and not behaving as expected in Android. We will investigate further and write back at you with additional information/ workaround for this issue!
Regards,
Nikolay Iliev
Telerik by Progress
Hi,
error in ios
2016-07-27 12:36:38.687 bossapp[752:226030] *** JavaScript call stack:
(
0 UIApplicationMain@[native code]
1 start@file:///app/tns_modules/application/application.js:233:26
2 @file:///app/app.js:16:25
3 promiseReactionJob@:1:11
)
2016-07-27 12:36:38.690 bossapp[752:226030] *** Terminating app due to uncaught exception 'NSUnknownKeyException', reason: '[<NSNull 0x3a56b310> setValue:forUndefinedKey:]: this class is not key value coding-compliant for the key scaleFactor.'
*** First throw call stack:
(0x23d3391b 0x234cee17 0x23d33629 0x244a71f3 0x244b96d3 0x244b969f 0x244b969f 0x244b969f 0x26375b5b 0x2634aee5 0x2634a7c5 0x2644d5f7 0x26341aff 0x2635a741 0x2635a101 0x2644d771 0x263594d1 0x2633d561 0x2633d221 0x2633c6e1 0x2633c3b5 0x26335b3b 0x23cf56c9 0x23cf39cd 0x23cf3dff 0x23c43229 0x23c43015 0x25233ac9 0x28315189 0x8b502c 0x8b1959 0x4a14b7 0x6ef0ab 0x6ece61 0x6f4c7d 0x6f4c89 0x6f4c89 0x6efab1 0x6af2d5 0x698241 0x792143 0x7e2ab9 0x4a6f0b 0x4d915b 0x2f0a1 0x238eb873)
libc++abi.dylib: terminating with uncaught exception of type NSException
My xml like this:
<chart:RadCartesianChart id="chart" selectionMode="Single" height="350" showLabels="true">
<chart:RadCartesianChart.series>
<chart:BarSeries
seriesName="Bar"
categoryProperty="name"
items="{{ info.chartSource1 }}"
valueProperty="{{item1[0]}}"
selectionMode="Series"
stackMode="Stack"
showLabels="true"
/>
<chart:BarSeries
seriesName="Bar1"
items="{{ info.chartSource1 }}"
valueProperty="{{item1[1]}}"
selectionMode="Series"
stackMode="Stack"
categoryProperty="name"
showLabels="true" />
<chart:BarSeries
seriesName="Bar2"
items="{{ source.chartSource1 }}"
valueProperty="{{item1[2]}}"
selectionMode="Series"
stackMode="Stack"
categoryProperty="name"
showLabels="true" />
</chart:RadCartesianChart.series>
my js:
var frameModule = require("ui/frame");
var scrollViewModule = require("ui/scroll-view");
var observableArray = require("data/observable-array");
var observable = require("data/observable");
// var moment = require("moment");
var observable_1 = require("data/observable");
var http = require("http");
var viewModel;
var page;
var slideContainer;
var chartArr1
var catArr = []
var weekArr = []
var deltaDays = 0
var monthNames = ["JAN", "FEB", "MAR", "APR", "MAY", "JUN",
"JUL", "AUG", "SEP", "OCT", "NOV", "DEC"]
function pageLoaded(args) {
page = args.object;
var barChart = page.getViewById('chart');
var observable = new observable_1.Observable();
nextButton = page.getViewById('next');
previousButton = page.getViewById('prev');
http.request({
url: "http://bossapp-erp.activbm.com/",
method: "POST",
headers: { "Content-Type": "application/x-www-form-urlencoded" },
content: 'loginDetails'
}).then(function (response) {
sidCookie = response.headers['Set-Cookie'][0].split(";")[0]
url = 'Url'
http.request({
url: url,
method: "GET",
headers: { "sid": sidCookie }
}).then(function (responses) {
var year = 2016
resultData = responses.content.toJSON().message
var responseResult =resultData["result"]
var gObj = {}
var gObjArr = []
var gObjCatArr = {}
// Create custom Object for easy traversing
for (var i = 0; i < responseResult.length; i++) {
var dateStr = responseResult[i][9] // current Node
if(!dateStr){
continue
}
if(!gObj[dateStr]){
gObj[dateStr] = gObj[dateStr] || {}
var obj = {}
obj[dateStr] = gObj[dateStr]
gObjArr.push(obj)
}
var catName = responseResult[i][2]
if(catArr.indexOf(catName) == -1){
catArr.push(catName)
}
var keyObj = Object.keys(gObj[dateStr])
if(keyObj.indexOf(catName) > -1){
gObj[dateStr][catName] = gObj[dateStr][catName] + responseResult[i][15]
}
else{
gObjCatArr[catName] = gObjCatArr[catName] || {}
gObj[dateStr][catName] = gObj[dateStr][catName] || 0 + responseResult[i][15]
}
}
console.log(catArr)
firstDateOfWeek = new Date; // get current date
firstDateOfWeek = new Date(firstDateOfWeek.setDate(firstDateOfWeek.getDate()-firstDateOfWeek.getDay()))
computeInfo()
function computeInfo(){
firstDateOfWeek = new Date(firstDateOfWeek.setDate(firstDateOfWeek.getDate() + 7*deltaDays))
buildWeek(firstDateOfWeek,gObj)
var weekPosition
if(firstDateOfWeek.getDate() % 7 == 1){
weekPosition = Math.ceil((firstDateOfWeek.getDate())/7)
} else {
weekPosition = Math.ceil((firstDateOfWeek.getDate())/7) + 1
}
observable.set("sliderFooter", monthNames[firstDateOfWeek.getMonth()]+ " Week -"+ weekPosition)
var chartSource1={}
chartSource1["chartSource1"] = weekArr
observable.set("info", chartSource1);
// observable.set("item1", catArr)
page.bindingContext = observable;
}
observable.set("onNext", function(eventData) {
deltaDays = 1
computeInfo()
});
observable.set("onPrevious", function(eventData) {
deltaDays = -1
computeInfo()
})
}, function (e) {
console.log("Error occurred " + e);
});
}, function (e) {
console.log("Error occurred " + e);
});
}
exports.pageLoaded = pageLoaded;
function buildWeek(pCurrDate,gObj){
weekArr = []
var currDate = new Date(pCurrDate)
for(var idx=0;idx <= 6; idx++) {
var strCurrDate = currDate.toISOString().slice(0,10)
var formattedDate = monthNames[currDate.getMonth()] + ' ' + currDate.getDate()
if(gObj[strCurrDate]){
gObj[strCurrDate].name = formattedDate
weekArr.push(gObj[strCurrDate])
}
else{
weekArr.push({"name":formattedDate})
}
currDate = new Date(currDate.setDate(currDate.getDate()+1))
}
}
exports.home = function() {
var topmost = frameModule.topmost();
topmost.navigate("views/home/homePage");
};
This Same code working in Android but ios it's not working . How can i fix this issue?
Based n the code you have provided I was not able to reproduce your project in working state and to receive the data you are loading. Perhaps, you can provide us with a sample project (via Github repository link or here with archive) so we can test your scenario locally.
Meanwhile, I can give you some possible reasons for what may cause your app to not work as expected.
One thing that I have noticed is that you are using HTTP requests (POST and GET) and in the protocol is not allowed and only requests through https are allowed. This may cause your data not to be received and accordingly to can not set an undefined key. (if you need to resolve this then you can add in your info.plist the key shown here - although I recommend to use it only for test purposes and in real iOS application to use the https instead of ). You can log what your POST and GET request are returning to assure in iOS you are receiving the expected data.
Another thing that I have noticed in your code is that you are binding using indexing syntax like item1[1].
Indexing in binding won't produce the expected behaviour - more about some extended binding techniques can be found at the following link: https://github.com/dmccuskey/nativescript-docs/blob/master/bindings.md
I did not notice the XML tags for setting verticalAxis and horizontalAxis (maybe they are part of your original project).
Please exam the issues above and if you need further assistance provide us with a test sample project in order to fully reproduce your scenario.
Regards,
Nikolay Iliev
Telerik by Progress
Hi,
how to do tap click in a particular bar chart in nativescript telerik pro?
tap click should go in a new page,
<chart:BarSeries
seriesName="Bar1"
categoryProperty="name"
items="{{ info.chartSource1 }}"
valueProperty="ExpenseOther"
stackMode="Stack"
showLabels="true" />
To handle the tap Event you could use pointSelectedEvent , which will be fire when some of the Bars has been selected. The Event also will return the index of the selected Bar in case you need to get data from the array you are loading the items in the Chart. Further information about this Event you could find in the documentation here. I am also attaching sample project, where have been shown how to use this feature.
main-page.xml
<Page xmlns="http://schemas.nativescript.org/tns.xsd" loaded="onPageLoaded" xmlns:chart="nativescript-telerik-ui-pro/chart"> <chart:RadCartesianChart id="cartesianChart" pointSelected="selectedIndex" > <chart:RadCartesianChart.series> <chart:BarSeries selectionMode="DataPoint" items="{{ categoricalSource }}" categoryProperty="Country" valueProperty="Amount"> <chart:BarSeries.horizontalAxis> <chart:CategoricalAxis/> </chart:BarSeries.horizontalAxis> <chart:BarSeries.verticalAxis> <chart:LinearAxis/> </chart:BarSeries.verticalAxis> </chart:BarSeries> </chart:RadCartesianChart.series> </chart:RadCartesianChart></Page>main-page.ts
import { EventData } from "data/observable";import { Page } from "ui/page";import {Observable, PropertyChangeData} from "data/observable";import {ChartEventData} from "nativescript-telerik-ui-pro/chart"export function onPageLoaded(args){ var page = args.object; var observable = new Observable(); var array:Array<any>=[{ Country: "Germany", Amount: 15, SecondVal: 14, ThirdVal: 24 }, { Country: "France", Amount: 13, SecondVal: 23, ThirdVal: 25 }, { Country: "Bulgaria", Amount: 24, SecondVal: 17, ThirdVal: 23 }, { Country: "Spain", Amount: 11, SecondVal: 19, ThirdVal: 24 }, { Country: "USA", Amount: 18, SecondVal: 8, ThirdVal: 21 }]; observable.set("categoricalSource", array); observable.addEventListener(Observable.propertyChangeEvent, function (pcd:PropertyChangeData) { console.log(pcd.eventName.toString() + " " + pcd.propertyName.toString() + " " + pcd.value.toString());}); page.bindingContext = observable;}export function selectedIndex(args:ChartEventData){ console.log("selected bar"); console.dump(args.pointIndex); alert("selectedIndex "+args.pointIndex)}I hope this will help
Regards,
Nikolay Tsonev
Hi,
I am not able to get selected stack details on click of the bar in stack mode in bar series
My Xml:-
<chart:RadCartesianChart id="chart" pointSelected="selectedIndex" selectionMode="Single" height="350" showLabels="false">
<chart:RadCartesianChart.series>
<chart:BarSeries
seriesName="Bar1"
categoryProperty="name"
items="{{ info.chartSource1 }}"
valueProperty="ExpenseOther"
stackMode="Stack"
showLabels="true"
selectionMode="DataPointMultiple" />
<chart:BarSeries
seriesName="Bar"
categoryProperty="name"
items="{{ info.chartSource1 }}"
valueProperty="ExpenseDirect"
stackMode="Stack"
showLabels="true"
selectionMode="DataPointMultiple" />
</chart:RadCartesianChart.series>
</<chart:RadCartesianChart>
My Js:-
chartArry1.push(janObj)
chartArry1.push(febObj)
chartArry1.push(marObj)
chartArry2.push(aprObj)
chartArry2.push(mayObj)
chartArry2.push(junObj)
chartArry3.push(julObj)
chartArry3.push(augObj)
chartArry3.push(sepObj)
chartArry4.push(octObj)
chartArry4.push(novObj)
chartArry4.push(decObj)
var monthNames = ["JAN", "FEB", "MAR", "APR", "MAY", "JUN",
"JUL", "AUG", "SEP", "OCT", "NOV", "DEC"]
var currentQuater = []
var currentQuaterCount = 0
var quaterMonth_1 = ["JAN", "FEB", "MAR"]
var quaterMonth_2 = ["APR", "MAY", "JUN"]
var quaterMonth_3 = ["JUL", "AUG", "SEP"]
var quaterMonth_4 = ["OCT", "NOV", "DEC"]
var footer = ""
var currentMonthName = monthNames[month]
// console.log("quater1Months"+currentMonthName)
if(quaterMonth_1.indexOf(currentMonthName)>-1){
// console.log("came this quater 1")
currentQuater = quaterMonth_1
chartSource1["chartSource1"] = chartArry1
footer ="1ST QUARTER -"+year
currentQuaterCount = 1
currentMonthCount = 1
}
else if(quaterMonth_2.indexOf(currentMonthName)>-1){
// console.log("came this quater 2")
currentQuater = quaterMonth_2
chartSource1["chartSource1"] = chartArry2
footer ="2ND QUARTER -"+year
currentQuaterCount = 2
currentMonthCount = 2
}
else if(quaterMonth_3.indexOf(currentMonthName)>-1){
// console.log("came this quater 3")
currentQuater = quaterMonth_3
chartSource1["chartSource1"] = chartArry3
footer ="3RD QUARTER -"+year
currentQuaterCount = 3
currentMonthCount = 3
}
else if(quaterMonth_4.indexOf(currentMonthName)>-1){
// console.log("came this quater 4")
currentQuater = quaterMonth_4
chartSource1["chartSource1"] = chartArry4
footer ="4TH QUARTER -"+year
currentQuaterCount = 4
currentMonthCount = 4
}
// chartSource1["chartSource1"] = chartArry3
// console.log("HAI")
observable.set("info", chartSource1);
observable.set("sliderFooter", footer)
page.bindingContext = observable;
function selectedIndex(args) {
alert("selectedIndex " + JSON.stringify(chartArry1 ));
}
exports.selectedIndex = selectedIndex;
Each StackMode value should shown as a alert or a new a page. i have four different QUARTER and each QUARTER have each array like chartarry1,2,3,4 this four Quarter shown through a slider now only one array can push to all QUARTER it is showing all data which contain in chartarry1 my chart img see below, there three different colours contain with different value when click on each colour it should show only that particular value in this stackMode bar chart
https://drive.google.com/open?id=0B1u4PKmp8y80STNOd21SdU5Kdkk
Thank you for contacting us.
I reviewed your code and tried to recreate your scenario by using the given code snippets, there are some missing resources, which prevent me from debugging your code. Nevertheless, I made new sample project, where I used BarSeries and pointSelectedEvent. You could review the attached example. Let me know whether this helps. If you still experience problems please send me the missing resources which will allow your application. It would help also if you could open new tickets for the new topic and issues you have got. That would help to review your problem and to give you better solution.
main-page.xml
<Page xmlns="http://schemas.nativescript.org/tns.xsd" loaded="onPageLoaded" xmlns:chart="nativescript-telerik-ui-pro/chart" xmlns="http://www.nativescript.org/tns.xsd"> <GridLayout> <chart:RadCartesianChart id="chart" pointSelected="selectedIndex" height="350"> <chart:RadCartesianChart.series> <chart:BarSeries items="{{ info.chartSource1 }}" showLabels="true" seriesName="Bar1" categoryProperty="Country" valueProperty="Amount" selectionMode="DataPoint"> <chart:BarSeries.horizontalAxis> <chart:CategoricalAxis/> </chart:BarSeries.horizontalAxis> <chart:BarSeries.verticalAxis> <chart:LinearAxis/> </chart:BarSeries.verticalAxis> </chart:BarSeries> <chart:BarSeries items="{{ info.chartSource1 }}" showLabels="false" seriesName="Bar" categoryProperty="Country" valueProperty="SecondVal" selectionMode="DataPoint"> <chart:BarSeries.horizontalAxis> <chart:CategoricalAxis/> </chart:BarSeries.horizontalAxis> <chart:BarSeries.verticalAxis> <chart:LinearAxis/> </chart:BarSeries.verticalAxis> </chart:BarSeries> </chart:RadCartesianChart.series> </chart:RadCartesianChart> </GridLayout></Page>main-page.ts
import { EventData } from "data/observable";import { Page } from "ui/page";import { HelloWorldModel } from "./main-view-model";import {ObservableArray} from "data/observable-array";import {Observable} from "data/observable";import {ChartEventData} from "nativescript-telerik-ui-pro/chart"// Event handler for Page "navigatingTo" event attached in main-page.xmlexport function onPageLoaded(args: EventData) { // Get the event sender var page = <Page>args.object; var observable = new Observable(); var array= [ { Country: "Germany", Amount: 15, SecondVal: 14, ThirdVal: 24 }, { Country: "France", Amount: 13, SecondVal: 23, ThirdVal: 25 }, { Country: "Bulgaria", Amount: 24, SecondVal: 17, ThirdVal: 23 }, { Country: "Spain", Amount: 11, SecondVal: 19, ThirdVal: 24 }, { Country: "USA", Amount: 18, SecondVal: 8, ThirdVal: 21 }]; observable.set("info", new Observable({"chartSource1":array})); page.bindingContext = observable;}export function selectedIndex(args:ChartEventData) { console.dump(args.pointIndex); //alert("selectedIndex " + args); }main-page.js
var observable_1 = require("data/observable");// Event handler for Page "navigatingTo" event attached in main-page.xmlfunction onPageLoaded(args) { // Get the event sender var page = args.object; var observable = new observable_1.Observable(); var array = [{ Country: "Germany", Amount: 15, SecondVal: 14, ThirdVal: 24 }, { Country: "France", Amount: 13, SecondVal: 23, ThirdVal: 25 }, { Country: "Bulgaria", Amount: 24, SecondVal: 17, ThirdVal: 23 }, { Country: "Spain", Amount: 11, SecondVal: 19, ThirdVal: 24 }, { Country: "USA", Amount: 18, SecondVal: 8, ThirdVal: 21 }]; observable.set("info", new observable_1.Observable({ "chartSource1": array })); page.bindingContext = observable;}exports.onPageLoaded = onPageLoaded;function selectedIndex(args) { console.dump(args.pointIndex); //alert("selectedIndex " + args);}exports.selectedIndex = selectedIndex;//# sourceMappingURL=main-page.js.mapThank you in advance for your cooperation.
Regards,
nikolay.tsonev
Telerik by Progress
Hi,
Can i set y axis hidden in IOS app using telerik nativscript pro chart ? in Android MARGIN-LEFT:-70; is working
There are to options to hide y-axis in the Chars.
The first one is to set the labels color to be similar to the background color. For Example:
<Page xmlns="http://schemas.nativescript.org/tns.xsd" loaded="onPageLoaded" xmlns:chart="nativescript-telerik-ui-pro/chart" xmlns="http://www.nativescript.org/tns.xsd"> <GridLayout> <chart:RadCartesianChart id="chart" pointSelected="selectedIndex" height="350"> <chart:RadCartesianChart.series> <chart:BarSeries items="{{ info.chartSource1 }}" showLabels="true" seriesName="Bar1" categoryProperty="Country" valueProperty="Amount" selectionMode="DataPoint"> <chart:BarSeries.horizontalAxis> <chart:CategoricalAxis/> </chart:BarSeries.horizontalAxis> <chart:BarSeries.verticalAxis> <chart:LinearAxis labelTextColor="white"/> </chart:BarSeries.verticalAxis> </chart:BarSeries> </chart:RadCartesianChart.series> </chart:RadCartesianChart> </GridLayout></Page>the second option is to use LinearAxis hidden property and to set it to true. You could find example below:
<Page xmlns="http://schemas.nativescript.org/tns.xsd" loaded="onPageLoaded" xmlns:chart="nativescript-telerik-ui-pro/chart" xmlns="http://www.nativescript.org/tns.xsd"> <GridLayout> <chart:RadCartesianChart id="chart" pointSelected="selectedIndex" height="350"> <chart:RadCartesianChart.series> <chart:BarSeries items="{{ info.chartSource1 }}" showLabels="true" seriesName="Bar1" categoryProperty="Country" valueProperty="Amount" selectionMode="DataPoint"> <chart:BarSeries.horizontalAxis> <chart:CategoricalAxis/> </chart:BarSeries.horizontalAxis> <chart:BarSeries.verticalAxis> <chart:LinearAxis hidden="true" /> </chart:BarSeries.verticalAxis> </chart:BarSeries> </chart:RadCartesianChart.series> </chart:RadCartesianChart> </GridLayout></Page>In regard to my previous answer. Could you open new tickets for the new topic and issues you have
Regards,
nikolay.tsonev
Telerik by Progress
Hi,
I am unable to capture the selected item when clicking on Action bar items :
<ActionBar.actionItems>
<ActionItem android.position="popup" text="Direct Income" tap="onContactTap" />
<ActionItem android.position="popup" text="Expence Direct" />
<ActionItem android.position="popup" text="Expence Others" />
<ActionItem android.position="popup" text="Back To Page" tap="back" />
</ActionBar.actionItems>
</ActionBar.titleView>
exports.onContactTap = function (args) {
console.log(args)
};
I am able to get the args on tap function.but the item clicked name is not getting caputerd.
Hi,
when showing a list view in Repeater i am not able to capture the item which is selected or the index of the item.the code is given below
<ListView id="listview" items="{{ myItems }}" itemTap="listViewItemTap">
<ListView.itemTemplate>
<StackLayout>
<Repeater items="{{ myItem2 }}" >
<Repeater.itemsLayout>
<StackLayout />
</Repeater.itemsLayout>
<Repeater.itemTemplate>
<StackLayout>
<Label class="textName" text="{{ $value.name }}" horizontalAlignment="stretch" />
<Label class="textName" text="{{ $value.class_name }}" horizontalAlignment="stretch" />
<Label class="textName" text="{{ $value.center_name }}" horizontalAlignment="stretch" />
</StackLayout>
</Repeater.itemTemplate>
</Repeater>
</StackLayout>
</ListView.itemTemplate>
</ListView>
Js:
function listViewItemTap(args) {
var itemIndex = args.index;
var object = args.view;
// var item = args.view.bindingContext;
console.log(object);
console.log(itemIndex);
}
In js i am able to capture the click but the selected item index is always shown as zero.
Thank you for reporting your problem and for the given code snippets.
I reviewed your scenario, I was unable to reproduce any of the reported . I tested the tap events of ActionBarItems and ListView and everything works as expected. For you I am attaching sample code, where have been used Listview and itemTapEvent. Could you review the given code snippets and to verify whether you will have the same problem.
Could you please open ticket for the new questions or problem. That would help us to review your problem and to give you solution.
main-page.xml
<Page xmlns="http://schemas.nativescript.org/tns.xsd" navigatingTo="navigatingTo"> <Page.actionBar> <ActionBar title="Title" icon=""> <ActionBar.actionItems> <ActionItem android.position="popup" text="Direct Income" tap="item1" /> <ActionItem android.position="popup" text="Expence Direct" tap="item2" /> <ActionItem android.position="popup" text="Expence Others" tap="item3" /> <ActionItem android.position="popup" text="Back To Page" tap="back" /> </ActionBar.actionItems> </ActionBar> </Page.actionBar> <StackLayout> <ListView id="listview" items="{{ myItems }}" itemTap="listViewItemTap"> <ListView.itemTemplate> <StackLayout> <Repeater items="{{ myItem2 }}" > <Repeater.itemsLayout> <StackLayout /> </Repeater.itemsLayout> <Repeater.itemTemplate> <StackLayout> <Label class="textName" text="{{ $value.name }}" horizontalAlignment="stretch" /> <Label class="textName" text="{{ $value.class_name }}" horizontalAlignment="stretch" /> <Label class="textName" text="{{ $value.center_name }}" horizontalAlignment="stretch" /> </StackLayout> </Repeater.itemTemplate> </Repeater> </StackLayout> </ListView.itemTemplate> </ListView> </StackLayout></Page>main-page.ts
import { EventData, Observable } from "data/observable";import { Page } from "ui/page";import { HelloWorldModel } from "./main-view-model";import {ObservableArray} from "data/observable-array";import {ItemEventData} from "ui/list-view"class DataItem{ constructor(public name:string, public class_name:string, public center_name:string){}}// Event handler for Page "navigatingTo" event attached in main-page.xmlexport function navigatingTo(args: EventData) { // Get the event sender var page = <Page>args.object; var array = new ObservableArray(); for(var j=0; j<10; j++){ var innerArray = []; for(var i=0; i<3; i++){ innerArray.push(new DataItem("name"+i, "class_name "+i, "center_name "+i)); } array.push(new Observable({"myItem2":innerArray})) } page.bindingContext = {myItems:array};}export function item1(args:EventData){ alert("item1 tap");}export function item2(args:EventData){ alert("item2 tap");}export function item3(args:EventData){ alert("item3 tap");}export function back(args:EventData){ alert("back tap");}export function listViewItemTap(args:ItemEventData) { var itemIndex = args.index; alert("selected item "+itemIndex)}main-page.js
var observable_1 = require("data/observable");var observable_array_1 = require("data/observable-array");var DataItem = (function () { function DataItem(name, class_name, center_name) { this.name = name; this.class_name = class_name; this.center_name = center_name; } return DataItem;}());// Event handler for Page "navigatingTo" event attached in main-page.xmlfunction navigatingTo(args) { // Get the event sender var page = args.object; var array = new observable_array_1.ObservableArray(); for (var j = 0; j < 10; j++) { var innerArray = []; for (var i = 0; i < 3; i++) { innerArray.push(new DataItem("name" + i, "class_name " + i, "center_name " + i)); } array.push(new observable_1.Observable({ "myItem2": innerArray })); } page.bindingContext = { myItems: array };}exports.navigatingTo = navigatingTo;function item1(args) { alert("item1 tap");}exports.item1 = item1;function item2(args) { alert("item2 tap");}exports.item2 = item2;function item3(args) { alert("item3 tap");}exports.item3 = item3;function back(args) { alert("back tap");}exports.back = back;function listViewItemTap(args) { var itemIndex = args.index; alert("selected item " + itemIndex);}exports.listViewItemTap = listViewItemTap;I hope this is applicable you.
Regards,
nikolay.tsonev
Telerik by Progress
Hi nikolay,
i have tried with the code provided from you.I am getting the alert when clicked on list view,but when there is more than 1 item in the list when clicked on other items the the console selected item is always shown as zero.
This was the issue i posted initially.
In regard to your question, itemTap method has been to get the index only for the items of the ListView. In regard to your code you are using Repeater inside the ListView.itemTemplate and event will be trigger when you tap on the whole section of generated from the Repeater. In case you would like to handle the event for every item generated from the Repeater you should set the tap event to the StackLayout. to be able to handle which element has been tapped you could bind the id attribute of the Layout and to set unique value in it. You could review .
main-page.xml
<Page xmlns="http://schemas.nativescript.org/tns.xsd" navigatingTo="navigatingTo"> <Page.actionBar> <ActionBar title="Title" icon=""> <ActionBar.actionItems> <ActionItem android.position="popup" text="Direct Income" tap="item1" /> <ActionItem android.position="popup" text="Expence Direct" tap="item2" /> <ActionItem android.position="popup" text="Expence Others" tap="item3" /> <ActionItem android.position="popup" text="Back To Page" tap="back" /> </ActionBar.actionItems> </ActionBar> </Page.actionBar> <StackLayout> <ListView id="listview" items="{{ myItems }}" > <ListView.itemTemplate> <StackLayout> <Repeater items="{{ myItem2 }}" > <Repeater.itemsLayout> <StackLayout /> </Repeater.itemsLayout> <Repeater.itemTemplate> <StackLayout id="{{$value.elementId}}" tap="onInnerElementTap"> <Label class="textName" text="{{ $value.name }}" horizontalAlignment="stretch" /> <Label class="textName" text="{{ $value.class_name }}" horizontalAlignment="stretch" /> <Label class="textName" text="{{ $value.center_name }}" horizontalAlignment="stretch" /> </StackLayout> </Repeater.itemTemplate> </Repeater> </StackLayout> </ListView.itemTemplate> </ListView> </StackLayout></Page>main-page.ts
import { EventData, Observable } from "data/observable";import { Page } from "ui/page";import { HelloWorldModel } from "./main-view-model";import {ObservableArray} from "data/observable-array";import {ItemEventData} from "ui/list-view"class DataItem{ constructor(public elementId:string, public name:string, public class_name:string, public center_name:string){}}// Event handler for Page "navigatingTo" event attached in main-page.xmlexport function navigatingTo(args: EventData) { // Get the event sender var page = <Page>args.object; var array = new ObservableArray(); for(var j=1; j<10; j++){ var innerArray = []; for(var i=0; i<3; i++){ innerArray.push(new DataItem("id "+i+j,"name"+i+j, "class_name "+i+j, "center_name "+i+j)); } array.push(new Observable({"myItem2":innerArray})) } page.bindingContext = {myItems:array};}export function item1(args:EventData){ alert("item1 tap");}export function item2(args:EventData){ alert("item2 tap");}export function item3(args:EventData){ alert("item3 tap");}export function back(args:EventData){ alert("back tap");}export function onInnerElementTap(args:EventData){ let object = args.object; let elId= object.get("id"); console.log("innser element id "+elId)}main-page.js
var observable_1 = require("data/observable");var observable_array_1 = require("data/observable-array");var DataItem = (function () { function DataItem(elementId, name, class_name, center_name) { this.elementId = elementId; this.name = name; this.class_name = class_name; this.center_name = center_name; } return DataItem;}());// Event handler for Page "navigatingTo" event attached in main-page.xmlfunction navigatingTo(args) { // Get the event sender var page = args.object; var array = new observable_array_1.ObservableArray(); for (var j = 1; j < 10; j++) { var innerArray = []; for (var i = 0; i < 3; i++) { innerArray.push(new DataItem("id " + i + j, "name" + i + j, "class_name " + i + j, "center_name " + i + j)); } array.push(new observable_1.Observable({ "myItem2": innerArray })); } page.bindingContext = { myItems: array };}exports.navigatingTo = navigatingTo;function item1(args) { alert("item1 tap");}exports.item1 = item1;function item2(args) { alert("item2 tap");}exports.item2 = item2;function item3(args) { alert("item3 tap");}exports.item3 = item3;function back(args) { alert("back tap");}exports.back = back;function onInnerElementTap(args) { var object = args.object; var elId = object.get("id"); console.log("innser element id " + elId);}exports.onInnerElementTap = onInnerElementTap;With this reply, I am also closing this forum thread as it discusses multiple topics, which makes it hard to use by our other community members. If you have issues with UI for NativeScript or would like to submit a feature request, please create a new support ticket or forum thread for the topic.
Thank you for your understanding.
Regards,
nikolay.tsonev
Telerik by Progress