# Exporting Spreadsheets with Bar Charts in .NET Standard
Convert spreadsheet charts to images before exporting the workbook to PDF in .NET Standard.
## Environment
| Version | Product | Author |
| ---------- | ------------------- | ------------------------------------------------------------------------------- |
| 2026.1.402 | RadSpreadProcessing | [Desislava Yordanova](https://www.telerik.com/blogs/author/desislava-yordanova) |
## Description
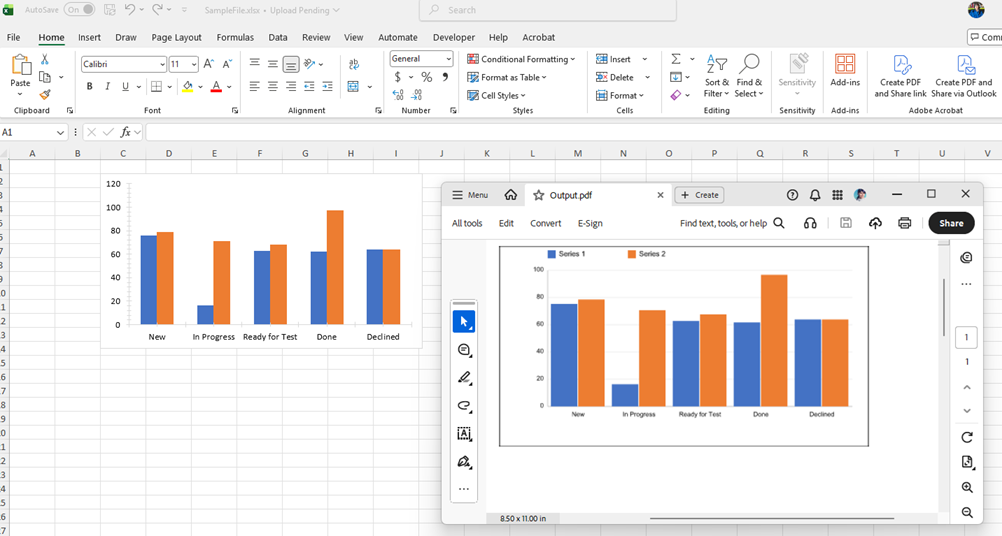
[RadSpreadProcessing](https://www.telerik.com/document-processing-libraries/documentation/libraries/radspreadprocessing/overview) provides support for exporting worksheets with chart objects to PDF format only in .NET Framework and .NET (Target OS: Windows). This article shows a custom approach to exporting Excel workbooks containing bar chart objects to PDF format using the Telerik Document Processing libraries. Because the standard PDF export does not natively render [FloatingChartShape](https://www.telerik.com/document-processing-libraries/documentation/libraries/radspreadprocessing/features/charts/chart-data) objects, this solution **converts each chart into a PNG image** and replaces the original chart shape with a [FloatingImage](https://www.telerik.com/document-processing-libraries/documentation/libraries/radspreadprocessing/features/shapes-and-images) at the same position before exporting to PDF.
 ## Solution
The provided solution follows these steps:
1. Generate a Workbook with Charts: The `GenerateWorkbookWithChart()` method builds a `Workbook` with a `Worksheet` containing a column chart. The chart is constructed programmatically using the Telerik SpreadProcessing model. The workbook is first exported to `.xlsx` format for verification.
2. Convert the Charts to image format: Call `ChartToImageConverter.ConvertChartToImage()` to render the chart as a PNG byte array.
3. Replace the Charts with the Images: Construct a `FloatingImage` at the same `CellIndex`, offset, width, and height as the original chart. Remove all original `FloatingChartShape` objects from the worksheet, then add the generated `FloatingImage` objects.
4. Export to PDF format: After replacement, the workbook (now containing images instead of charts) is exported to PDF using `PdfFormatProvider`.
> note The `ChartToImageConverter` class is the core of the custom implementation. It uses the **Telerik Fixed Document API** (`RadFixedDocument`, `FixedContentEditor`) to draw a visual representation of the chart, then exports the rendered page to PNG using `SkiaImageFormatProvider`.
The example is divided into consecutive C# blocks. Combine the blocks in order: the first three form the `Program` class, and the remaining blocks form `ChartToImageConverter`. Individual blocks are not standalone examples.
Use these links to navigate the implementation:
* [Generating and exporting the workbook](https://www.telerik.com/document-processing-libraries/documentation/knowledge-base/export-spreadsheet-with-chart-net-standard#generating-and-exporting-the-workbook)
* [Creating the chart](https://www.telerik.com/document-processing-libraries/documentation/knowledge-base/export-spreadsheet-with-chart-net-standard#creating-the-chart)
* [Replacing charts with images](https://www.telerik.com/document-processing-libraries/documentation/knowledge-base/export-spreadsheet-with-chart-net-standard#replacing-charts-with-images)
* [Preparing the chart image](https://www.telerik.com/document-processing-libraries/documentation/knowledge-base/export-spreadsheet-with-chart-net-standard#preparing-the-chart-image)
* [Reading the series data](https://www.telerik.com/document-processing-libraries/documentation/knowledge-base/export-spreadsheet-with-chart-net-standard#reading-the-series-data)
* [Calculating axis bounds](https://www.telerik.com/document-processing-libraries/documentation/knowledge-base/export-spreadsheet-with-chart-net-standard#calculating-axis-bounds)
* [Resolving series colors](https://www.telerik.com/document-processing-libraries/documentation/knowledge-base/export-spreadsheet-with-chart-net-standard#resolving-series-colors)
* [Drawing axes and grid lines](https://www.telerik.com/document-processing-libraries/documentation/knowledge-base/export-spreadsheet-with-chart-net-standard#drawing-axes-and-grid-lines)
* [Drawing bars and category labels](https://www.telerik.com/document-processing-libraries/documentation/knowledge-base/export-spreadsheet-with-chart-net-standard#drawing-bars-and-category-labels)
* [Drawing the legend and exporting PNG](https://www.telerik.com/document-processing-libraries/documentation/knowledge-base/export-spreadsheet-with-chart-net-standard#drawing-the-legend-and-exporting-png)
### Generating and Exporting the Workbook
Begin the `Program` class with `Main`, which exports the sample workbook to XLSX, replaces charts with images, and exports to PDF:
```csharp
internal class Program
{
static void Main(string[] args)
{
Telerik.Documents.ImageUtils.ImagePropertiesResolver defaultImagePropertiesResolver = new Telerik.Documents.ImageUtils.ImagePropertiesResolver();
Telerik.Windows.Documents.Extensibility.FixedExtensibilityManager.ImagePropertiesResolver = defaultImagePropertiesResolver;
Workbook workbook = GenerateWorkbookWithChart();
string fileName = "SampleFile.xlsx";
Telerik.Windows.Documents.Spreadsheet.FormatProviders.OpenXml.Xlsx.XlsxFormatProvider formatProvider = new Telerik.Windows.Documents.Spreadsheet.FormatProviders.OpenXml.Xlsx.XlsxFormatProvider();
using (Stream output = new FileStream(fileName, FileMode.Create))
{
formatProvider.Export(workbook, output, TimeSpan.FromSeconds(10));
}
Process.Start(new ProcessStartInfo() { FileName = fileName, UseShellExecute = true });
ReplaceChartWithImages(workbook);
Telerik.Windows.Documents.Spreadsheet.FormatProviders.Pdf.PdfFormatProvider pdfFormatProvider = new PdfFormatProvider();
string outputFilePath = "Output.pdf";
File.Delete(outputFilePath);
using (Stream output = File.OpenWrite(outputFilePath))
{
pdfFormatProvider.Export(workbook, output, TimeSpan.FromSeconds(10));
}
Process.Start(new ProcessStartInfo() { FileName = outputFilePath, UseShellExecute = true });
}
```
### Creating the Chart
Continue the `Program` class with `GenerateWorkbookWithChart`, which creates the worksheet and its two-series column chart:
```csharp
private static Workbook GenerateWorkbookWithChart()
{
Workbook workbook = new Workbook();
Worksheet worksheet = workbook.Worksheets.Add();
FloatingChartShape chartShape = new FloatingChartShape(worksheet, new CellIndex(1, 2), new CellRange(1, 1, 1, 1), ChartType.Column)
{
Width = 460,
Height = 250
};
DocumentChart chart = new DocumentChart();
BarSeriesGroup barSeriesGroup = new BarSeriesGroup();
barSeriesGroup.BarDirection = BarDirection.Column;
StringChartData barCategoryData = new StringChartData(new List { "New", "In Progress", "Ready for Test", "Done", "Declined" });
NumericChartData barValueScore1Data = new NumericChartData(new List { 75.31, 16.3, 62.78, 61.72, 63.9 });
NumericChartData barValueScore2Data = new NumericChartData(new List { 78.56, 70.7, 67.63, 96.71, 63.9 });
barSeriesGroup.Series.Add(barCategoryData, barValueScore1Data);
barSeriesGroup.Series.Add(barCategoryData, barValueScore2Data);
chart.SeriesGroups.Add(barSeriesGroup);
ValueAxis valueAxis = new ValueAxis();
valueAxis.Outline.Fill = new SolidFill(new ThemableColor(ThemeColorType.Text1, 0.85));
valueAxis.Outline.Width = 0.75;
CategoryAxis categoryAxis = new CategoryAxis();
categoryAxis.Outline.Fill = new SolidFill(new ThemableColor(ThemeColorType.Text1, 0.85));
categoryAxis.Outline.Width = 0.75;
chart.PrimaryAxes = new AxisGroup(categoryAxis, valueAxis);
worksheet.Charts.Add(chartShape);
worksheet.Charts[0].Chart.SeriesGroups.First().Series.First().Title = new TextTitle("Team 1");
worksheet.Charts[0].Chart.SeriesGroups.First().Series.Last().Title = new TextTitle("Team 2");
chartShape.Chart = chart;
return workbook;
}
```
### Replacing Charts with Images
Finish the `Program` class with `ReplaceChartWithImages`, which renders each chart and adds a `FloatingImage` in its place:
```csharp
private static void ReplaceChartWithImages(Workbook workbook)
{
// Iterate all charts in all worksheets, generate images, and replace charts with images
foreach (Worksheet ws in workbook.Worksheets)
{
var chartShapes = ws.Charts.ToList();
var imagesToAdd = new List<(FloatingImage image, byte[] data)>();
foreach (FloatingChartShape cs in chartShapes)
{
byte[] imageBytes = ChartToImageConverter.ConvertChartToImage(cs, workbook.Theme);
if (imageBytes.Length == 0) continue;
FloatingImage floatingImage = new FloatingImage(ws, cs.CellIndex, cs.OffsetX, cs.OffsetY)
{
Width = cs.Width,
Height = cs.Height
};
floatingImage.ImageSource = new Telerik.Windows.Documents.Media.ImageSource(imageBytes, "png");
imagesToAdd.Add((floatingImage, imageBytes));
}
// Remove all chart shapes
foreach (FloatingChartShape cs in chartShapes)
{
ws.Charts.Remove(cs);
}
// Add images
foreach (var (image, _) in imagesToAdd)
{
ws.Images.Add(image);
}
}
}
}
```
### Preparing the Chart Image
Begin the `ChartToImageConverter` class and its `ConvertChartToImage` method by creating a PDF page and defining the chart area:
```csharp
internal static class ChartToImageConverter
{
public static byte[] ConvertChartToImage(FloatingChartShape chartShape, DocumentTheme theme = null)
{
double width = chartShape.Width;
double height = chartShape.Height;
RadFixedDocument document = new RadFixedDocument();
RadFixedPage page = document.Pages.AddPage();
page.Size = new Size(width, height);
FixedContentEditor editor = new FixedContentEditor(page);
DocumentChart chart = chartShape.Chart;
if (chart == null)
{
return Array.Empty();
}
// Draw background
editor.GraphicProperties.FillColor = new RgbColor(255, 255, 255);
editor.DrawRectangle(new Rect(0, 0, width, height));
double marginLeft = 60;
double marginRight = 20;
double marginTop = 30;
double marginBottom = 50;
double chartAreaWidth = width - marginLeft - marginRight;
double chartAreaHeight = height - marginTop - marginBottom;
```
### Reading the Series Data
Continue inside `ConvertChartToImage` to collect the series titles, values, and category labels:
```csharp
// Collect all series data
var allSeriesData = new List<(string title, List values)>();
var categoryLabels = new List();
foreach (var seriesGroup in chart.SeriesGroups)
{
foreach (var series in seriesGroup.Series)
{
string title = $"Series {allSeriesData.Count + 1}";
if (series.Title is TextTitle textTitle)
{
title = textTitle.Text;
}
var values = new List();
if (series is CategorySeriesBase catSeries)
{
if (catSeries.Values is NumericChartData numericData)
{
values.AddRange(numericData.NumericLiterals);
}
if (categoryLabels.Count == 0 && catSeries.Categories is StringChartData stringCatData)
{
categoryLabels.AddRange(stringCatData.StringLiterals);
}
}
allSeriesData.Add((title, values));
}
}
if (allSeriesData.Count == 0)
{
return Array.Empty();
}
int categoryCount = categoryLabels.Count > 0 ? categoryLabels.Count : allSeriesData.Max(s => s.values.Count);
int seriesCount = allSeriesData.Count;
```
### Calculating Axis Bounds
Continue inside `ConvertChartToImage` to read the axis limits or calculate a rounded maximum from the data:
```csharp
// Use axis min/max from the chart's ValueAxis when available
double dataMax = allSeriesData.SelectMany(s => s.values).DefaultIfEmpty(0).Max();
double minValue = 0;
double maxValue = dataMax;
if (chart.PrimaryAxes != null)
{
var valueAxis = chart.PrimaryAxes.ValueAxis;
if (valueAxis != null)
{
if (valueAxis.Min.HasValue)
minValue = valueAxis.Min.Value;
if (valueAxis.Max.HasValue)
maxValue = valueAxis.Max.Value;
}
}
// If max was not explicitly set, round up to a nice value (Excel-style: 0, 10, 20, ...)
bool maxExplicit = chart.PrimaryAxes?.ValueAxis?.Max.HasValue == true;
if (!maxExplicit)
{
double roughInterval = dataMax / 5.0;
if (roughInterval <= 0) roughInterval = 1;
double magnitude = Math.Pow(10, Math.Floor(Math.Log10(roughInterval)));
double residual = roughInterval / magnitude;
double niceInterval;
if (residual <= 1.5) niceInterval = 1 * magnitude;
else if (residual <= 3.5) niceInterval = 2 * magnitude;
else if (residual <= 7.5) niceInterval = 5 * magnitude;
else niceInterval = 10 * magnitude;
maxValue = Math.Ceiling(dataMax / niceInterval) * niceInterval;
}
```
### Resolving Series Colors
Continue inside `ConvertChartToImage` to resolve the series fill colors, using fallback colors when needed:
```csharp
// Extract original fill colors from each series
var seriesColors = new List();
RgbColor[] fallbackColors = new RgbColor[]
{
new RgbColor(79, 129, 189),
new RgbColor(192, 80, 77),
new RgbColor(155, 187, 89),
new RgbColor(128, 100, 162),
new RgbColor(75, 172, 198)
};
int seriesIdx = 0;
foreach (var seriesGroup in chart.SeriesGroups)
{
foreach (var series in seriesGroup.Series)
{
RgbColor color = fallbackColors[seriesIdx % fallbackColors.Length];
if (series.Fill is SolidFill solidFill)
{
var themableColor = solidFill.Color;
Telerik.Documents.Media.Color actualColor = theme != null
? themableColor.GetActualValue(theme)
: themableColor.LocalValue;
color = new RgbColor(actualColor.R, actualColor.G, actualColor.B);
}
seriesColors.Add(color);
seriesIdx++;
}
}
```
### Drawing Axes and Grid Lines
Continue inside `ConvertChartToImage` to draw the axes, horizontal grid lines, and value labels:
```csharp
// Draw axes
editor.GraphicProperties.StrokeColor = new RgbColor(180, 180, 180);
editor.GraphicProperties.StrokeThickness = 0.75;
editor.DrawLine(new Point(marginLeft, marginTop),
new Point(marginLeft, marginTop + chartAreaHeight));
editor.DrawLine(new Point(marginLeft, marginTop + chartAreaHeight),
new Point(marginLeft + chartAreaWidth, marginTop + chartAreaHeight));
// Grid lines and Y-axis labels
int gridLineCount = 5;
for (int i = 0; i <= gridLineCount; i++)
{
double yVal = minValue + (maxValue - minValue) * i / gridLineCount;
double yPos = marginTop + chartAreaHeight - (chartAreaHeight * i / gridLineCount);
editor.GraphicProperties.StrokeColor = new RgbColor(220, 220, 220);
editor.GraphicProperties.StrokeThickness = 0.5;
editor.DrawLine(new Point(marginLeft, yPos),
new Point(marginLeft + chartAreaWidth, yPos));
editor.SavePosition();
editor.Position.Translate(marginLeft - 55, yPos - 6);
Block labelBlock = new Block();
labelBlock.HorizontalAlignment = Telerik.Windows.Documents.Fixed.Model.Editing.Flow.HorizontalAlignment.Right;
labelBlock.TextProperties.FontSize = 8;
labelBlock.InsertText(yVal.ToString("F0"));
editor.DrawBlock(labelBlock, new Size(50, 12));
editor.RestorePosition();
}
```
### Drawing Bars and Category Labels
Continue inside `ConvertChartToImage` to draw each series value as a bar and add the category labels:
```csharp
// Draw bars
double groupWidth = chartAreaWidth / categoryCount;
double barGap = 4;
double totalBarWidth = groupWidth - barGap * 2;
double singleBarWidth = totalBarWidth / seriesCount;
for (int catIdx = 0; catIdx < categoryCount; catIdx++)
{
for (int serIdx = 0; serIdx < seriesCount; serIdx++)
{
double value = catIdx < allSeriesData[serIdx].values.Count ? allSeriesData[serIdx].values[catIdx] : 0;
double barHeight = (value - minValue) / (maxValue - minValue) * chartAreaHeight;
double barX = marginLeft + catIdx * groupWidth + barGap + serIdx * singleBarWidth;
double barY = marginTop + chartAreaHeight - barHeight;
RgbColor color = seriesColors[serIdx % seriesColors.Count];
editor.GraphicProperties.FillColor = color;
editor.GraphicProperties.StrokeColor = color;
editor.GraphicProperties.StrokeThickness = 0;
editor.DrawRectangle(new Rect(barX, barY, singleBarWidth - 1, barHeight));
}
if (catIdx < categoryLabels.Count)
{
double labelX = marginLeft + catIdx * groupWidth;
double labelY = marginTop + chartAreaHeight + 5;
editor.SavePosition();
editor.Position.Translate(labelX, labelY);
Block catBlock = new Block();
catBlock.HorizontalAlignment = Telerik.Windows.Documents.Fixed.Model.Editing.Flow.HorizontalAlignment.Center;
catBlock.TextProperties.FontSize = 8;
catBlock.InsertText(categoryLabels[catIdx]);
editor.DrawBlock(catBlock, new Size(groupWidth, 30));
editor.RestorePosition();
}
}
```
### Drawing the Legend and Exporting PNG
Finish `ConvertChartToImage` by drawing the legend and exporting the page as PNG bytes. This block also closes the `ChartToImageConverter` class:
```csharp
// Draw legend
double legendX = marginLeft;
double legendY = 5;
for (int serIdx = 0; serIdx < seriesCount; serIdx++)
{
RgbColor color = seriesColors[serIdx % seriesColors.Count];
double itemX = legendX + serIdx * 100;
editor.GraphicProperties.FillColor = color;
editor.GraphicProperties.StrokeThickness = 0;
editor.DrawRectangle(new Rect(itemX, legendY, 10, 10));
editor.SavePosition();
editor.Position.Translate(itemX + 14, legendY - 1);
Block legendBlock = new Block();
legendBlock.TextProperties.FontSize = 9;
legendBlock.InsertText(allSeriesData[serIdx].title);
editor.DrawBlock(legendBlock, new Size(80, 14));
editor.RestorePosition();
}
// Export page to PNG
SkiaImageFormatProvider imageProvider = new SkiaImageFormatProvider();
imageProvider.ExportSettings = new SkiaImageExportSettings()
{
ImageFormat = SkiaImageFormat.Png
};
byte[] imageBytes;
using (MemoryStream ms = new MemoryStream())
{
imageProvider.Export(page, ms, TimeSpan.FromSeconds(10));
imageBytes = ms.ToArray();
}
return imageBytes;
}
}
```
## NuGet Packages
| Package | Purpose |
| ------------------------------------------------------- | -------------------------------------------- |
| `Telerik.Documents.Spreadsheet` | Workbook/Worksheet model, chart objects |
| `Telerik.Documents.Spreadsheet.FormatProviders.OpenXml` | XLSX export |
| `Telerik.Documents.Spreadsheet.FormatProviders.Pdf` | PDF export |
| `Telerik.Documents.Fixed.FormatProviders.Image.Skia` | PNG rendering of `RadFixedPage` |
| `Telerik.Documents.ImageUtils` | `ImagePropertiesResolver` for image handling |
## Limitations
* The rendered chart image is a **simplified column/bar chart**. Other chart types (line, pie, scatter, and so on) are not currently supported by the converter.
* The visual output is an approximation—font rendering, exact spacing, and styling may differ from the native Excel chart rendering.
* Cropping alone does not export a native `FloatingChartShape`. The cross-platform workflow in this article draws a simplified chart representation with `FixedContentEditor` and exports that drawing to PNG. It does not crop Excel's native chart rendering.
* Theme color resolution requires passing the `DocumentTheme`. If the theme is unavailable, the converter falls back to `ThemableColor.LocalValue`.
## See Also
* [FixedContentEditor](https://www.telerik.com/document-processing-libraries/documentation/libraries/radpdfprocessing/editing/fixedcontenteditor)
* [SkiaImageFormatProvider](https://www.telerik.com/document-processing-libraries/documentation/libraries/radpdfprocessing/formats-and-conversion/convert-to-image/using-image-format-provider)
* [Export Chart to PDF](https://www.telerik.com/document-processing-libraries/documentation/libraries/radspreadprocessing/features/charts/pdf-export)
* [Exporting Images to PDF format in .NET Standard](https://www.telerik.com/document-processing-libraries/documentation/libraries/radpdfprocessing/cross-platform/images)
* [How to Eliminate Formatting Issues when Exporting XLSX to PDF Format](https://www.telerik.com/document-processing-libraries/documentation/knowledge-base/exporting-xlsx-to-pdf-formatting-issues)